Examining the US cost of production
DELVING INTO THE COP OF OUR SOUTHERN NEIGHBOURS
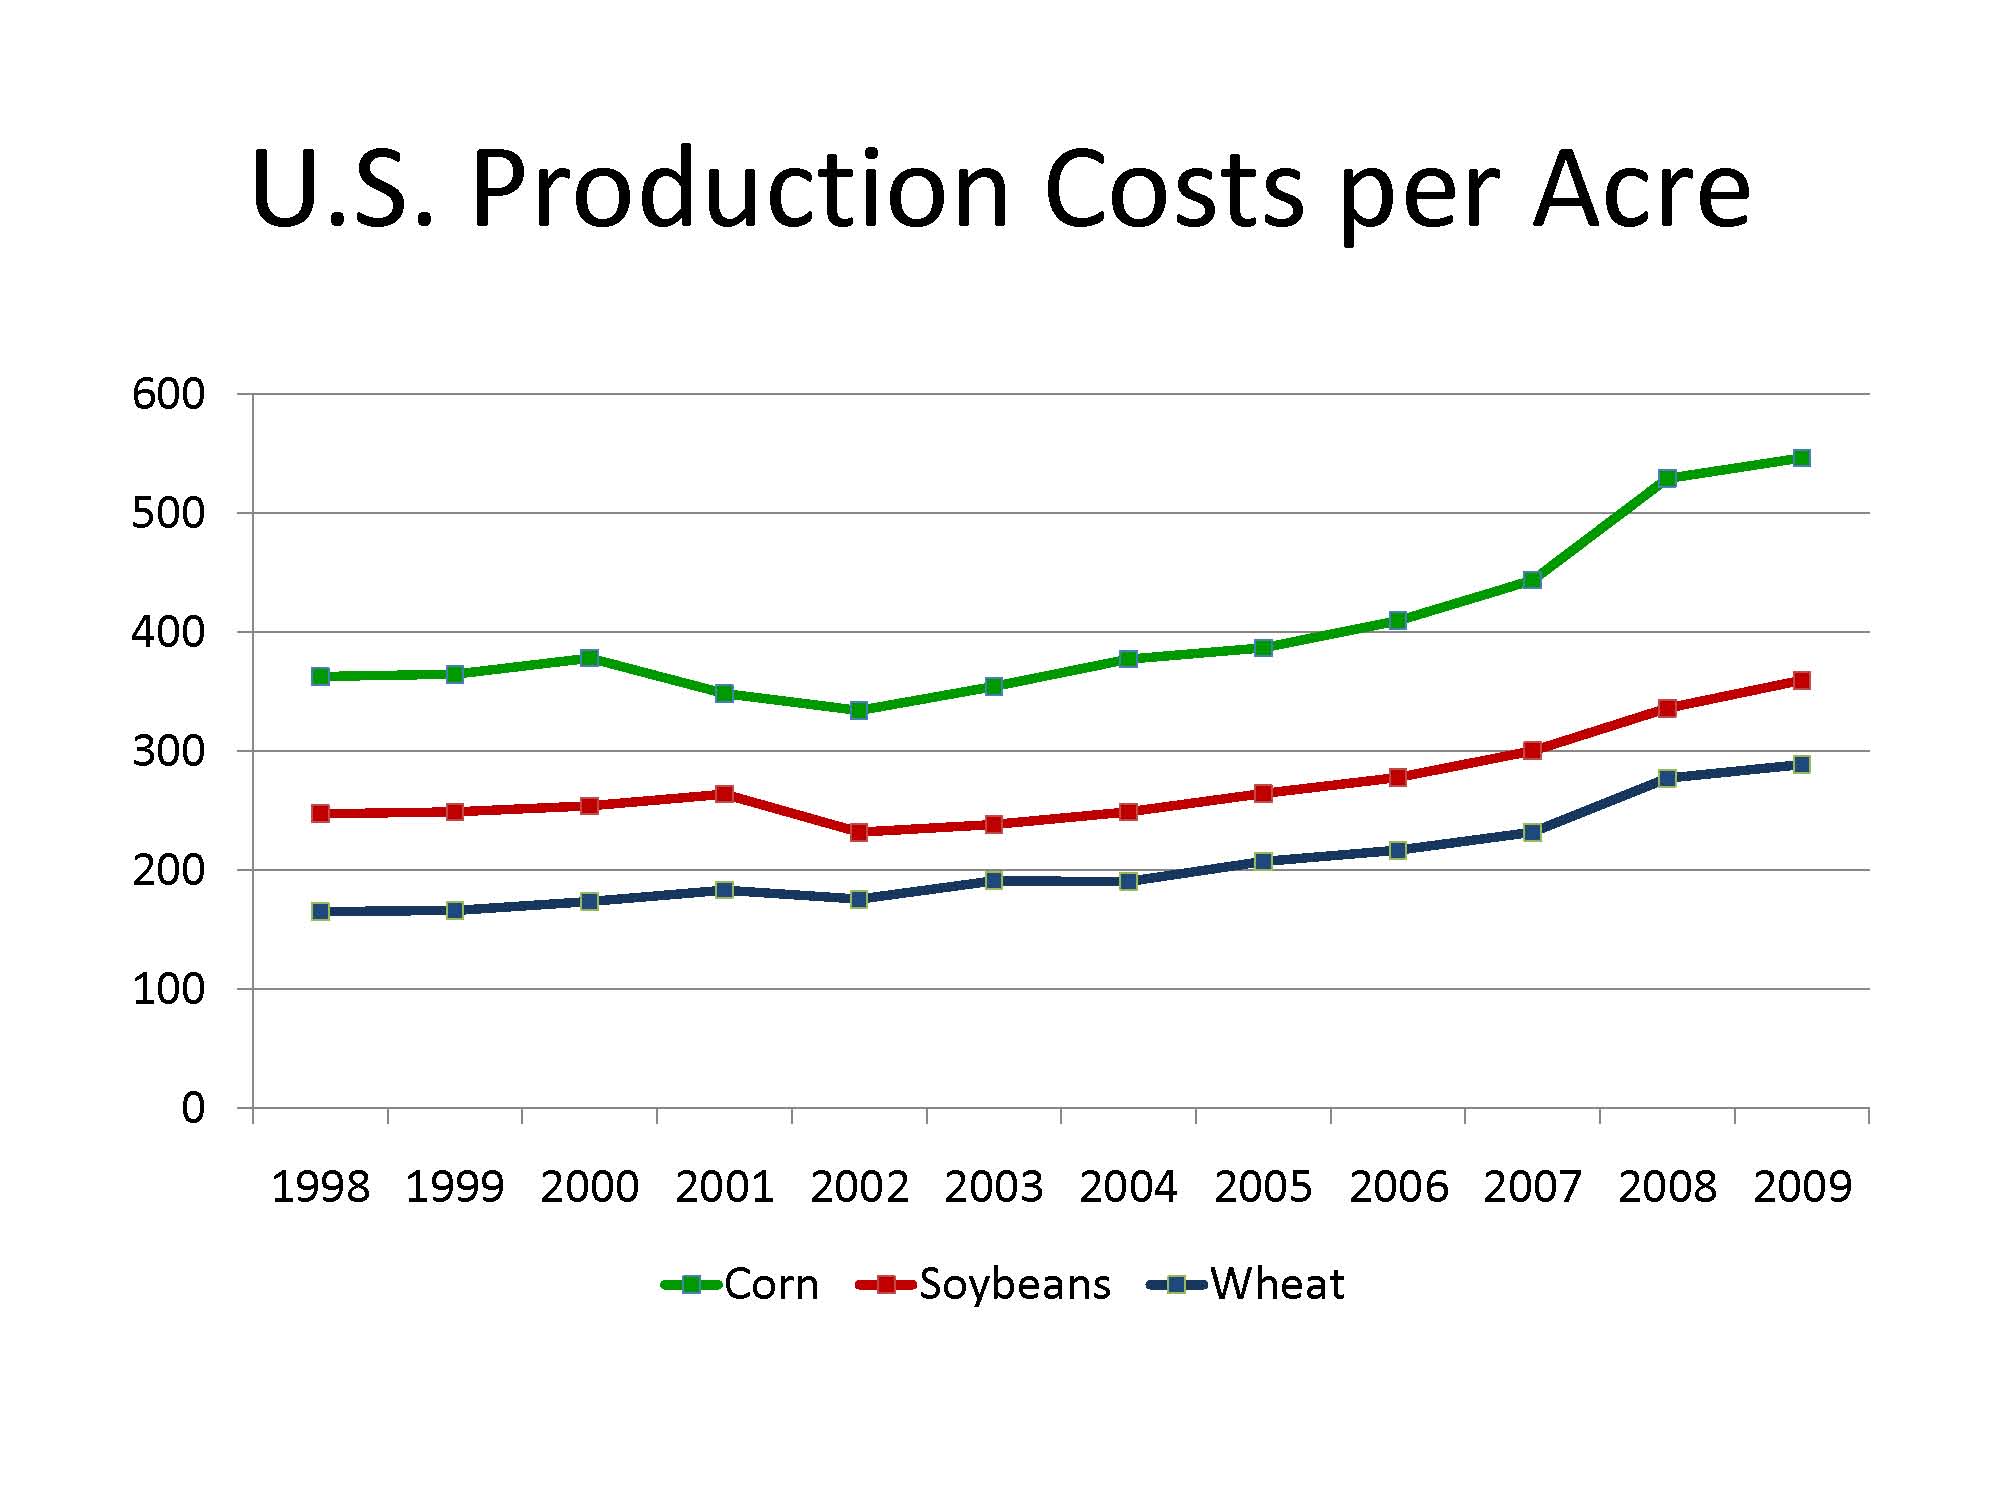
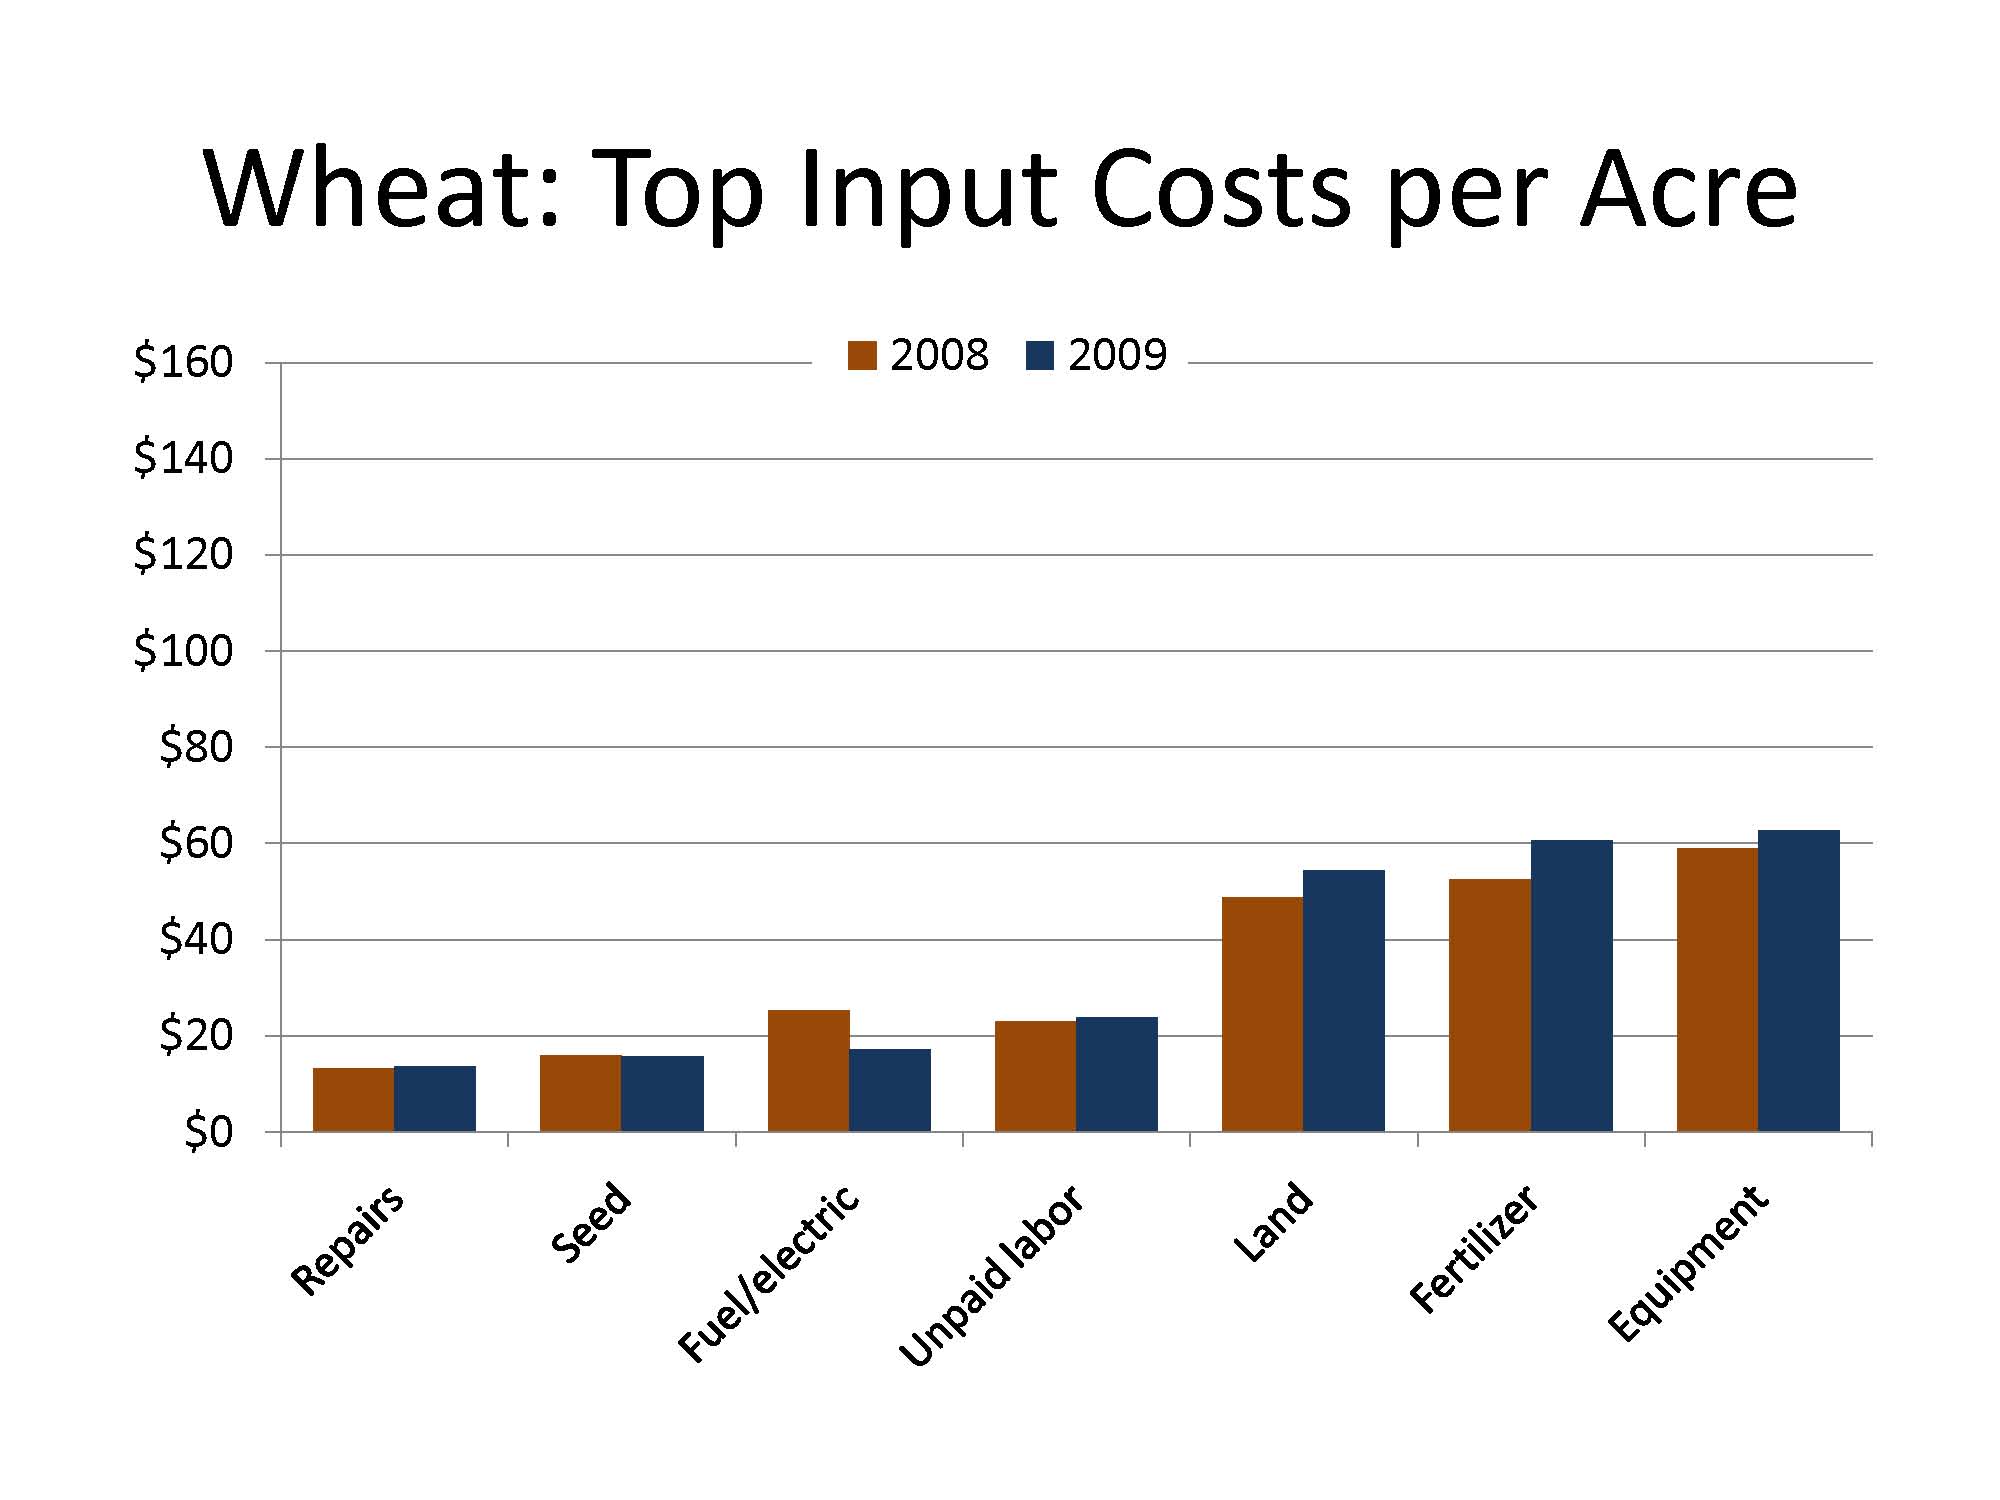
$288.83 per acre of wheat
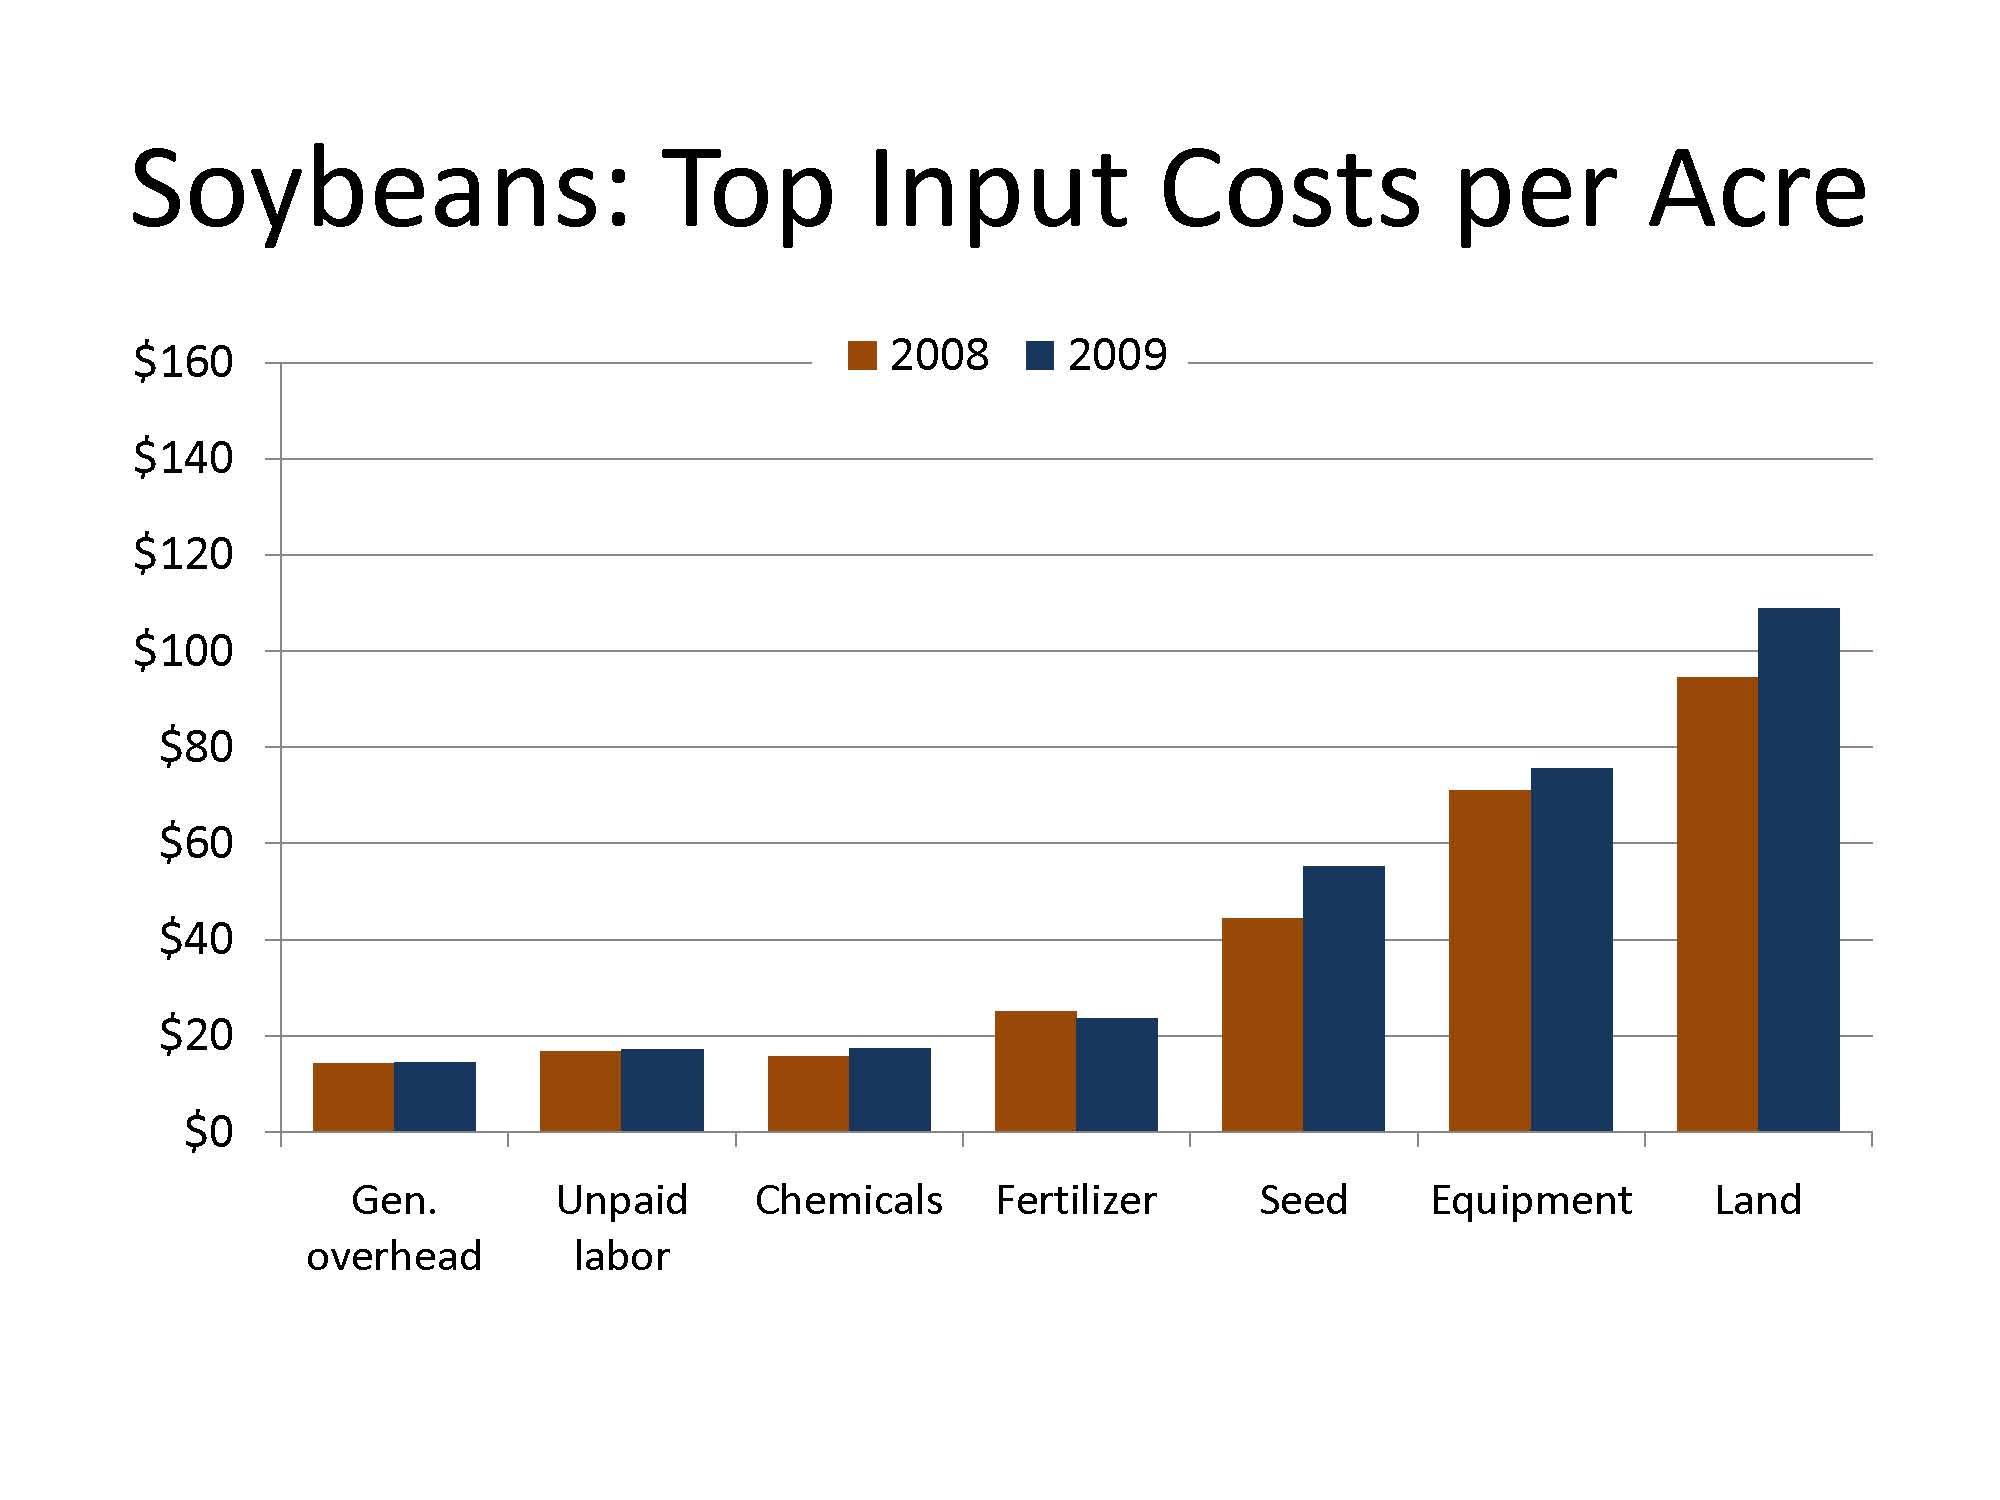
$359.74 for soybeans
$546.63 for corn
those are the average US production costs for 2009, but it’s only by looking beyond the national average that the numbers tell much about what US farmers actually spend on inputs.
That’s not surprising when you consider the widely different farming conditions across the country. The major corn-producing states stretch a thousand miles from east to west. For wheat, the distances are even greater – 1,600 miles from Washington State to eastern Kansas.
For each crop, those distances mean different soils, terrains, climate, insect pressures and more, and that means differing input needs.
Since 1975, the US Department of Agriculture has maintained a database of annual production costs and returns, based on producer surveys conducted every four to eight years and updated annually with estimates of annual price, acreage and production changes.
regional variation
In addition to the national spending averages for major input categories (see table), it breaks down the data based on growing regions, and it’s these regional input estimates that begin to give a sense of how varied US production costs are. For example:
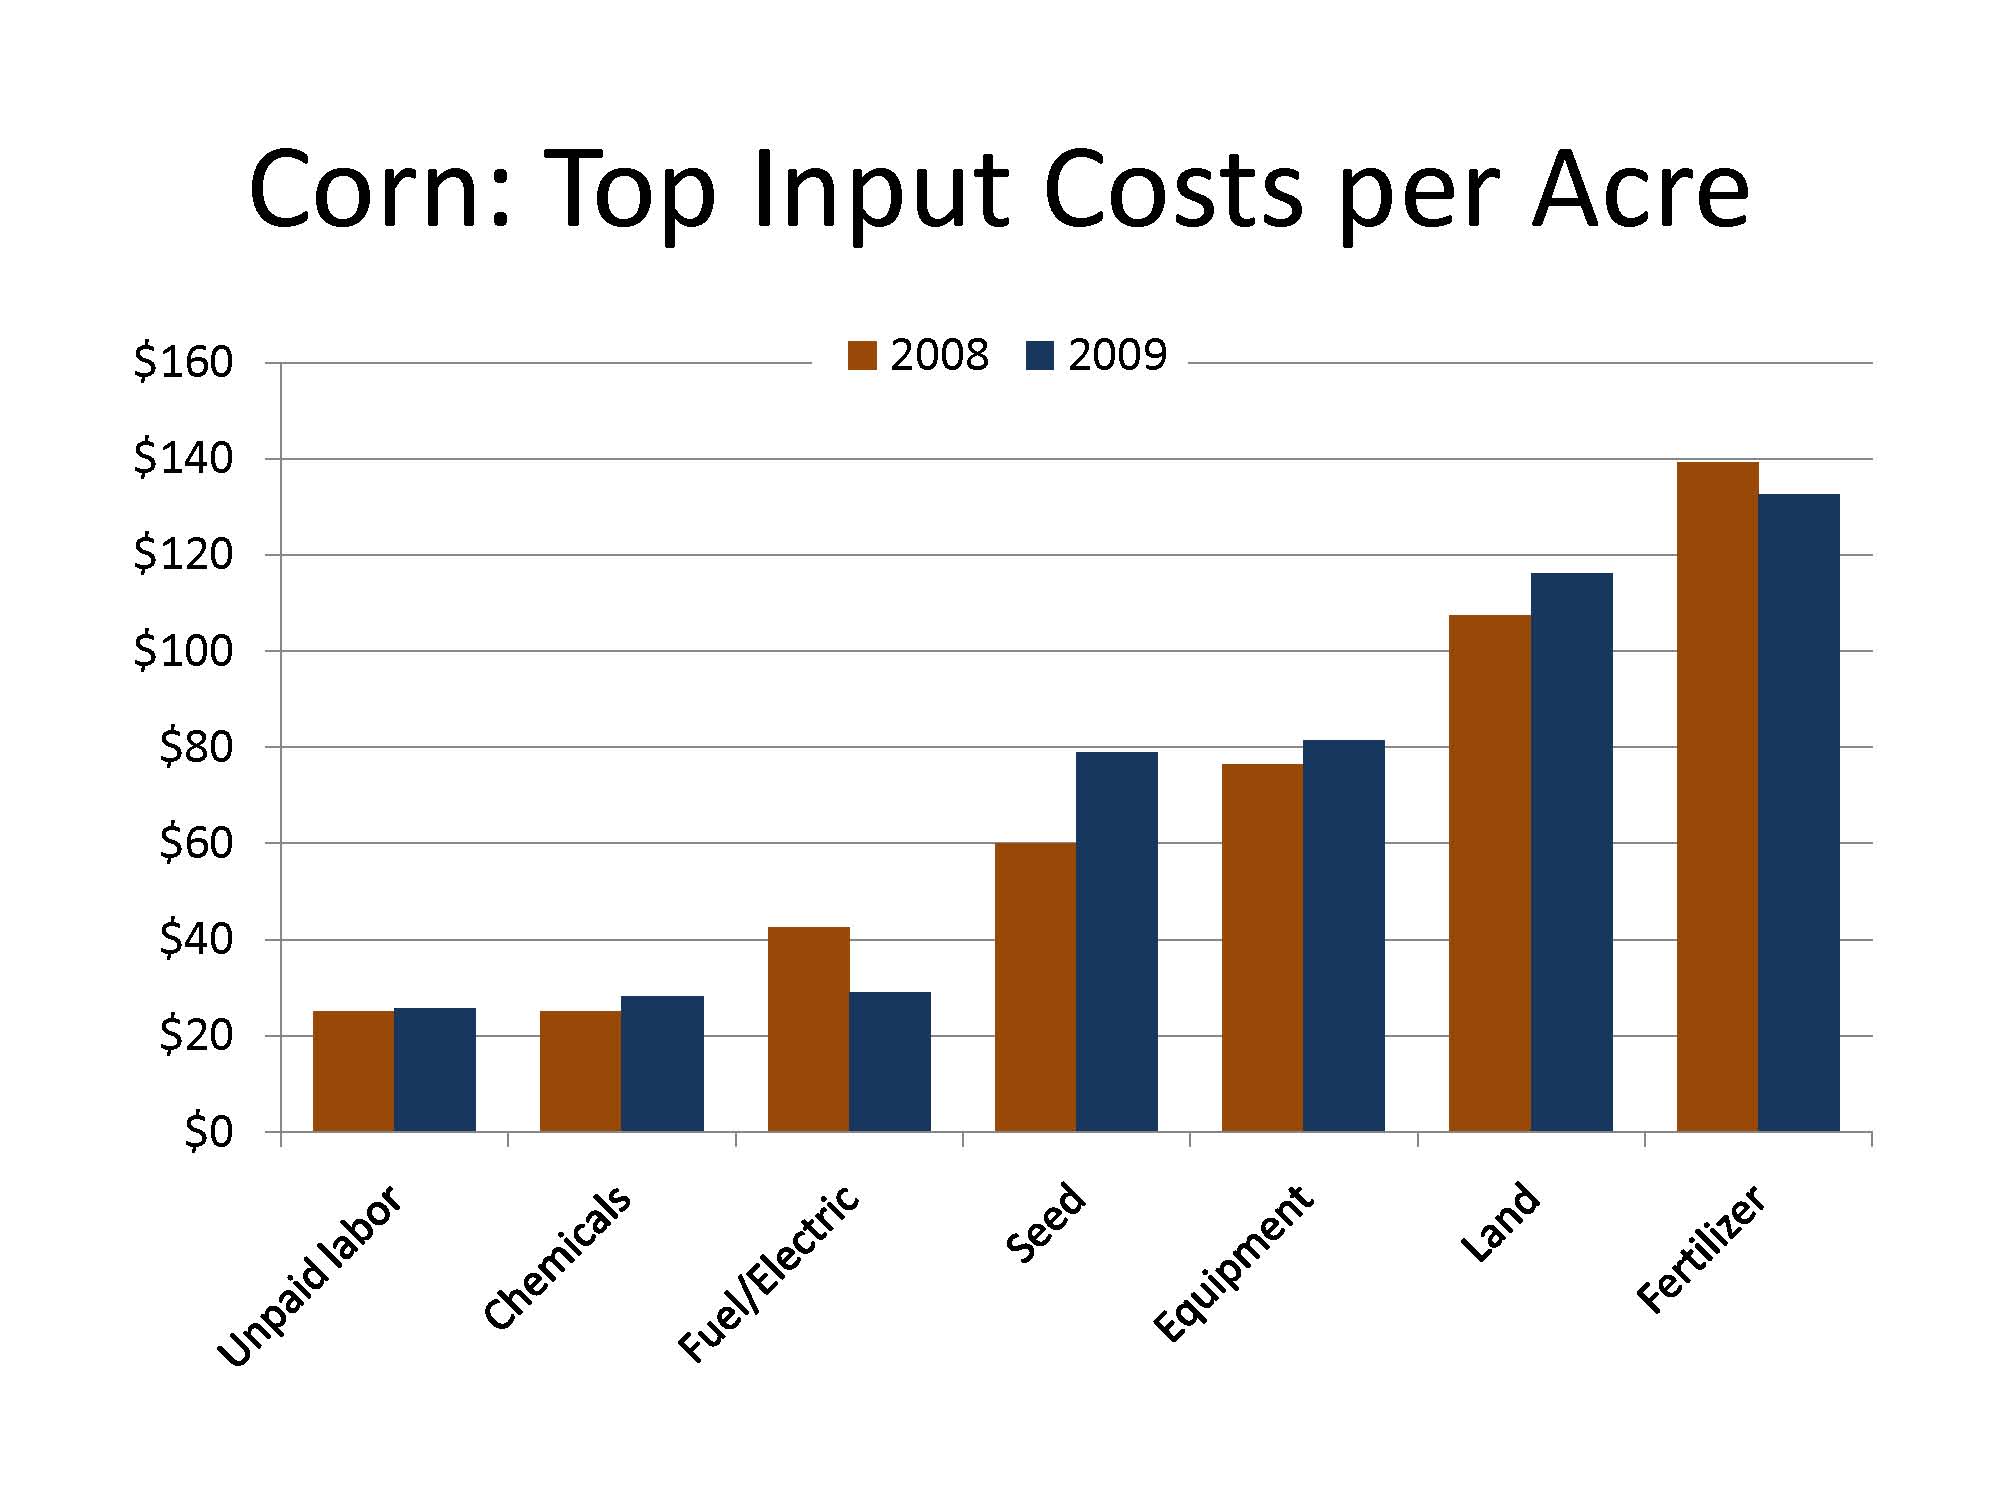
Corn fertilizer costs averaged $132.53 per acre nationally in 2009 but ranged from $88.70 in the northern Great Plains to $168.69 in eastern upland states like Kentucky.
Farmers in the northern Great Plains spent $1.79 per acre of corn to purchase irrigation water while growers in Iowa, Illinois and Indiana averaged less than a penny per acre for irrigation.
Energy costs – fuel, lubrication, electricity – averaged $29.08 per acre of corn nationally but $66.97 per acre for the region from central Nebraska south through Kansas, Oklahoma and much of Texas.
There are major variations in the opportunity cost (rental rate) for land. Average regional corn rents range from $69.58 in southeastern states to $133.40 in the heart of the Corn Belt and wheat rents vary almost as much – from $41.07 in the Nebraska-Kansas-Texas region to $104.80 in parts of the Pacific Northwest.
annual variation
How dollars get spent also varies from year to year. For example, 2009’s late corn harvest and cold, wet conditions meant more outlays for propane to dry the crop, and any year with a serious outbreak of soybean aphids will push up chemical outlays.
Annual shifts can also reflect changes in technology. From 2008 to 2009 the average per acre cost of corn seed jumped from $60.02 to $78.92 as Monsanto rolled out its higher priced Genuity® SmartStax® seed and other seed companies moved to similar pricing.
beyond the farm gate
It’s also important to glance beyond the farm-specific numbers when comparing US farming costs to the Ontario experience. Health care isn’t a farming input, but by choosing to farm, US growers must self-insure their health, unless they can access insurance through a secondary off-farm job or through their spouse.
It’s not a farm production expense, but it is an outlay that goes with being a US farmer. The average price tag in Iowa was about $11,000 per year for a family in 2008 – so a family with 1,000 acres could well spend as much per acre on health insurance as they spent on repairs and more than they spent on custom operations.
detailed information
For those who like to dig into the details, the numbers are available by crop, by region, by year and by expense category – if you’re willing to brave the depths of some US Department of Agriculture internet sites.
| Average Dollars per Acre by Region | Corn | Soybeans | Wheat |
| Operating Costs (in US dollars) | $Low-High | $Low-High | $Low-High |
| Seed | 71.04 – 80.61 | 50.52 – 57.94 | 11.08 – 41.03 |
| Fertilizer (including manure) | 88.70 – 168.69 | 10.64 – 60.11 | 52.15 – 125.96 |
| Chemicals | 19.81 – 30.96 | 13.48 – 21.79 | 4.58 – 17.41 |
| Custom operations | 7.68 – 16.05 | 5.78 – 10.47 | 7.11 – 12.91 |
| Fuel/lube/electricity | 19.68 - 66.97 | 9.52 – 25.43 | 8.28 – 52.90 |
| Repairs | 13.29 – 23.90 | 10.42 – 19.37 | 10.42 – 21.10 |
| Purchased irrigation | 0 – 0.179 | 0 – 1.76 | 0.09 – 3.37 |
| Interest on operating inputs | 0.35 – 0.46 | 0.16 – 0.22 | 0.16 – 0.30 |
| Allocated overhead: | |||
| Hired labor | 1.32 – 6.92 | 1.26 – 7.31 | 1.19 – 8.24 |
| Opportunity cost of unpaid labor | 22.44 – 42.77 | 14.45 – 20.81 | 16.29 – 38.48 |
| Capital recovery machinery/equipment | 73.24 – 100.68 | 62.51 – 88.58 | 58.17 – 99.58 |
| Opportunity cost of land (rental rate) | 69.56 – 133.40 | 49.46 – 127.92 | 41.07 – 104.80 |
| Taxes and insurance | 5.83 – 12.92 | 8.28 – 13.43 | 7.25 – 14.47 |
| General farm overhead | 10.32 – 19.81 | 10.51 – 18.80 | 7.28 – 16.50 |
| Total costs listed: | $452.84 – 563.25 | $287.75 – 367.28 | $258.74 – 461.27 |
To find US cost-of-production statistics on the internet, go to www.ers.usda.gov. In the left column under “Browse by subject,” click on “crops.” Scroll down past “Briefing Rooms” to “Data Products” and click on “ARMS Farm Financial and Crop Production Practices.” In the note on “Costs and Returns” (just after “Farm Production Practices”), click on “Commodity Costs and Returns.” Scroll down below “Data Directories” to click on “See all the data files.” This will take you to a screen where you can select the commodity you want.
In addition to national data, you’ll find data by major growing region – for example, the northern Great Plains or the Heartland (the US Corn Belt).
State cost-of-production data for some of the largest agricultural states – for example Iowa and Illinois for corn and soybeans or Minnesota for wheat – is available at www.nass.usda.gov. Scroll down the left column to “Statistics by State” and click on the state you want. Then scroll down to “Iowa Publications” (for example) and choose “Annual Statistical Bulletin” from the pull-down menu to reach commodity production costs.
Finally, Iowa State University Extension’s Ag Decision Maker site offers production cost estimates that vary based on crop rotational choices such as corn following corn or corn following soybeans at www.extension.iastate.edu/ Publications/fm1712.pdf. •


