Market side: Futures trading basics
LESSON 24: TRIANGLE FORMATIONS

This monthly educational series will feature the basic workings of the futures and options markets and how they can be utilized to help farmers with risk management.

THIS LESSON WE will discuss the descending triangle formation and how to trade it.
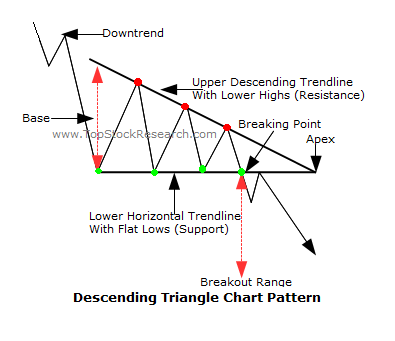
The descending triangle is a bearish formation that usually forms during a down-trend and it is typically a continuation pattern. A bearish pattern indicates that the price of the security will continue lower upon the completion of the current move or trend. The descending triangle pattern is formed by two trend-lines. The first is a flat or a horizontal line forming a temporary bottom and the top line is a continuing downward sloping line making lower highs until the apex is reached whereby the floor usually gives way to the pressure. Because of its shape, the pattern can also be referred to as a right-angle triangle. The price of the security moves between these two trend lines until it breaks out to the down-side. The breaking of the lower support line indicates the completion of the pattern and signals a bearish trend. Though the descending triangle usually appears in a down-trend and is considered a continuation pattern, sometimes it may appear in an up-trend. Therefore it is not unexpected to see a descending pattern to develop at the end of a up-trend.
HOW TO TRADE A DESCENDING TRIANGLE FORMATION
As the highs of each bar continue to move lower towards the flat bottom of the angle, the pressure mounts until the price finally breaks through the lower flat surface in the direction of the current move.
Once this lower level is penetrated, the price continues lower as the flat surface is now a resistance level instead of the support level that it was before the breakout. A basic tenet of technical analysis is that resistance turns into support and vice versa.
There are many ways to play this formation, but I find the best way is to wait until the break is confirmed by a close below the flat line. Once that is achieved, I would be comfortable to enter the short side of the trade with a stop above the bottom of the ascending side of the triangle. The image below shows the strategy that I personally would use.
Finally, there is a method that I use whereby I wait for the confirmation of the breakout and a close below the flat line and then wait patiently for a move back to the breakout point. This is a test of the resistance, but many times we do not get the opportunity of such a pullback and thereby miss the move.
Once the breakout has occurred, the price projection target is found by measuring the height of the base and using it as an extension from the breakout point and projecting an equal distance down from the breakout. •
Marty Hibbs is a 25 year veteran futures trader, analyst, and portfolio manager. Hibbs was a regular guest analyst on BNN for four years. He is currently a grain merchandiser with Grain Farmers of Ontario.
|
Lesson Definitions: Base: The widest part of the formation of a triangle pattern. In the image provided, the base is indicated by a red line. |
DISCLAIMER: This information has been compiled from sources believed to be reliable, but no representation or warranty, express or implied, is made by the author, by Grain Farmers of Ontario, or by any other person as to its accuracy, completeness or correctness and Grain Farmers of Ontario accepts no liability whatsoever for any loss arising from any use of same.