Understanding precision agriculture
HOW DO YOU KNOW WHAT WORKS AND WHAT DOESN'T?
YOU’VE CRUNCHED THE data, identified your management zones and created nutrient and seed population prescription maps. Now, how can you be sure that you’re actually making a measureable, positive impact on your fields?
This, according to the applied researchers leading the Precision Agriculture Advancement for Ontario (PAAO) project, is why validation needs to play an important part in any precision agriculture operation.
Validation can help growers nail down what’s working and not working within the nutrient and seed population prescriptions that they’ve assigned to their field’s high, medium, and low-yielding management zones.
“One of the biggest questions we hear about prescription mapping is ‘will this work and will it do what I think it’s going to do,’” says Ben Rosser, corn specialist with the Ontario Ministry of Agriculture, Food and Rural Affairs (OMAFRA). “There isn’t any magic button that will tell you whether a prescription works or not, but there are processes that can be established before you go out with your maps.”
Rosser and the PAAO applied research team — which also includes OMAFRA land resource specialist Nicole Rabe and applied research coordinator Ian McDonald — have been looking at two methods that growers could use to help validate their management zones and prescription maps.
VALIDATION
One method involves pre-programming at least two small check blocks called “learning stamps” into the prescription map. These learning stamps have a high and low rate of either seed or fertilizer to help the grower check if they assigned the right prescription rate to their management zone.
“When you think about it, the learning stamp method is all about placing small plots at field scale,” says Rabe. “And it can be a powerful tool to help you assess an agronomic decision that was made.”
Once harvest for a season is completed, growers should look at the as-applied map to ensure the correct nutrient or seeding rates went into each learning stamp.
Next, yield data within the prescribed check stamps must be cleaned up to remove any application delays — caused by a planter or sprayer switching between rates — as the grower moves in and out of the check areas.
“You want your learning stamp blocks to be a good size so that you can capture enough yield data that’s accurate from application to harvest time,” explains Rabe. “Carefully lining up your equipment passes is also important when you’re working with learning stamps.”
She adds that setting pre-defined guidance lines for a field can also help growers create a good, accurate prescription map with built-in learning stamps.
Once yield data is clipped out of the learning stamp blocks, a piece of yield data needs to be taken from the base zone, so that three total rates are represented: the high and low check block rates, and the prescribed base zone rate.
After the yield data is summarized, growers can then look at the economics for each area — based on input costs and yield — to see if they made the right fertilizer or seeding rate decision that season.
Rabe says that growers wanting to do their own learning stamp-style tests should keep things as simple as possible and stick to one variable so that they don’t run into any other competing factors in the field.
“The easiest strategy to get started is by varying the rate of seed or fertilizer until you know exactly what’s working in your climate and on your particular soils,” she explains.
LEARNING FROM EXPERIENCE
In their own variable population studies within the PAAO project, Rabe and the applied research team are finding that corn can get a higher rate in the high-yielding zones and a low rate in the low-yielding zones.
On soybeans, they are putting lower populations in the high yielding corn zones — due to higher disease pressure in wetter years — and higher rates in the low yielding zones.
Then, the researchers strategically place an ultra-low (100,000 seeds/ac) and ultra-high (200,000 seeds/ac) population learning block, so they can validate whether lower seeding rates can deliver higher yields.
“A rule of thumb for corn is to spread your rates at least 3,000 to 4,000 seeds per acre apart,” explains Rabe. “On soybeans, you need larger seeding rate changes to see response changes within a zone and between zones.”
She adds that growers should aim to put their learning strips or blocks in the centre of the management zone that has fairly even soil, water, and geographical characteristics in order to get the most consistent data possible.
“You don’t want the set of blocks in a very hilly area, or one check on top of the hill, or one check on the bottom of the hill,” she says.
Replicating each set of blocks is also a good strategy to ensure that growers are seeing a true nitrogen or fertilizer response in each growing season.
Rabe says that growers should aim to put out check blocks three times within a management zone and in different areas of that zone, as management zone maps can be generalized due to equipment limitation reasons, and not show all the variability within a zone.
“What replication does is help give us confidence that the entire management zone responded in a similar way for that particular season,” says Rabe. “If you were to put just one check block or strip out there, you could end up seeing a completely opposite response from one season to the next.”

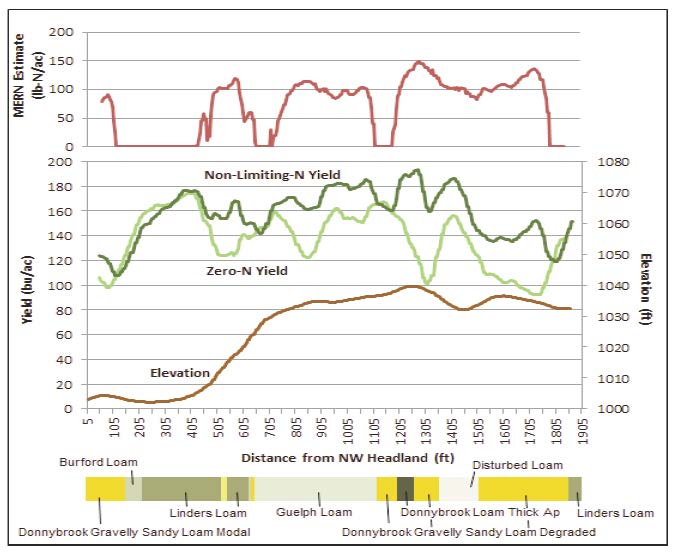
MAXIMUM ECONOMIC RATE OF NITROGEN (MER-N) VALIDATION
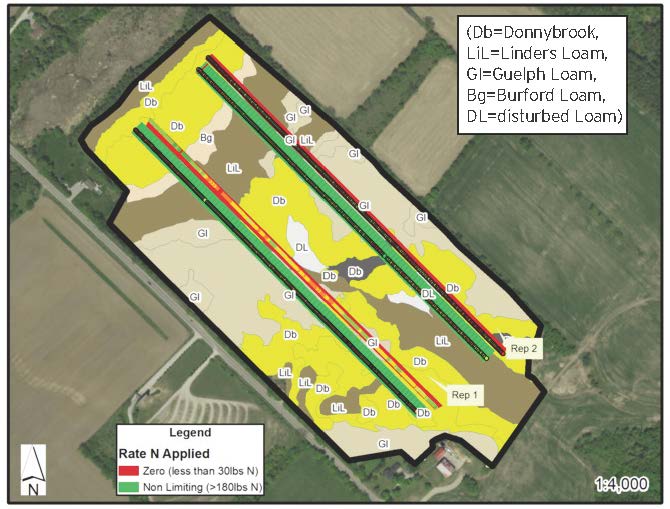
It is notable that in the depression near the NW headland (100’-450’) that the non-limiting nitrogen strip yields were no higher than the zero nitrogen strips yields, and thus there was no yield response to applying nitrogen in this area. While not to the same magnitude, zero nitrogen yields also spike in other depression areas, suggesting these areas may be responding to greater natural soil nitrogen supply. Conversely, zero nitrogen yields tend to dip near knoll tops, which may suggest lower natural soil nitrogen supply. This pattern in zero nitrogen yields would be consistent with expectations for soil movement — greater zero nitrogen yields in areas with more topsoil (erosion deposition) which likely mineralize more nitrogen, and lower yields in areas with less topsoil (erosion losses) which likely mineralize less. In this field, depressions were consistent with loam type soils, while knoll tops were more consistent with gravely/sandy-loam type soils.
In this field, the grower also noted better catches of red clover following the wheat crop in 2015 in areas with better topsoil, and particularly in the depression near the beginning of the yield strips where zero and non-limiting nitrogen strips were no different.
This also demonstrates the challenge of using the yield layer alone to drive a nitrogen management strategy — there are high yielding areas that may demand more nitrogen, but if they are occurring because they are in an area of deep top soil may also have more nitrogen supply. There may be cases, such as in this field, where both high and low yielding areas need more than the average amount of nitrogen, and cases where they need less than the average amount of nitrogen.
Right now, Rabe and the applied research team are trying to nail down what exact size learning blocks should be to gather accurate data, while fitting within management zones that are different sizes and shapes.
CHECK STRIPS
Another simpler validation approach that the applied researchers are looking at involves laying down check strips that run the length of a grower’s field and touch all three management zones.
Rosser says these check strips can often be manually implemented by putting in a couple of flat rates and then replicating these strips in another area of the field.
“The farmer doesn’t necessarily need to invest in a lot of new equipment to pull off this strategy,” says Rosser. “They just need to know where those passes are at harvest time.”
He says that flagging each pass or marking them with GPS (handheld or guidance monitor) can help with yield data collection later. And if a grower’s fertilizer or planting equipment is already equipped, then the as-applied map should also show where the check strips went down when it comes time to do a post-harvest analysis.
An example of validation through check strips is maximum economic rate of nitrogen (MER-N). Growers can apply a “zero” strip as well as a high-rate, “enriched” strip. The zero-nitrogen strip yields, explains Rosser, can help illustrate how much natural nitrogen is being supplied by the soil. Meanwhile, the high enriched strip can show what a management zone’s yield potential would be if nitrogen weren’t a limiting factor. The difference between the two indicates the relative responsiveness to nitrogen, and could be compared to prospective management zones down the length of the strips.
“As we take yield data from the enriched and zero nitrogen strips, we can see what the optimum nitrogen rate would’ve been going down that length of yield using a previously developed MER-N estimation tool,” says Rosser.
Growers can use the N-Rate Calculator available on www.gocorn.net to quickly calculate their optimum nitrogen rates.
Growers can also go back to the yield data from enriched and zero-nitrogen strips and then look at other data layers, such as elevation and soil chemistry, to see what other factors could be having an impact on yield and productivity.
Rabe says when looking at other data layers together with full-length strips, the research team is finding that, so far, soil texture appears to have the strongest connection to yield.
“Full-length check strips can help capture most of the geographic and soil variability across your field,” she explains. “That being said, they do take up a lot of space and can be a difficult sell — especially when you’re asking a cooperator to apply a zero-nitrogen strip through their entire field.”
Rabe says the advantage of using learning stamps over full-length strips is that they allow growers to put out multiple checks and gather yield information with a much smaller footprint.
“What we’re finding is that there are strengths and weaknesses to both validation approaches,” says Rabe. “That’s why we’re relying on our grower cooperators to share their data with us so that we can continue to get a better idea of what’s effective and what isn’t.”
This project was funded in part through Growing Forward 2 (GF2), a federal-provincial-territorial initiative. The Agricultural Adaptation Council assists in the delivery of GF2 in Ontario.
Precision Agriculture Advancement for Ontario: This article is part of a series dedicated to helping farmers understand and implement precision agriculture technology. It is based on research conducted by Nicole Rabe, Ian McDonald, and Ben Rosser at OMAFRA, in conjunction with Mike Duncan,?Sarah Lepp, and Gregor MacLean at Niagara College.
For more on precision agriculture go to: www.gfo.ca/Research/Understanding-Precision-Ag. •


