Market side: Futures trading basics
LESSON 27: TECHNICAL ANALYSIS

This monthly educational series will feature the basic workings of the futures and options markets and how they can be utilized to help farmers with risk management.

GAP TYPES – PART ONE
GAPS OCCUR AT different positions on a price chart. The position of the gap on the chart has a direct bearing on the name of that particular type of gap. The four gaps that we will explore over the next two lessons will be discussed in the order which they generally appear on a chart. These include breakaway gaps, runaway gaps (also referred to as a measuring gap), the exhaustion gap, and finally an island reversal.
Our first one, the breakaway gap appears as a move away from a congested area leaving a space between the last price and the current price. This space or gap in trading can be of significance. This usually presents itself after prices have been confined in a range without any real direction. When the breakaway move comes, it usually has enough momentum that the price lunges or gaps higher or lower and thus breaks away from the congestion giving it the name breakaway gap. They are easily identified as the first gap which could be followed by a strong move in one direction. The breakaway can break in either direction and appear as a price drop or a price rise.
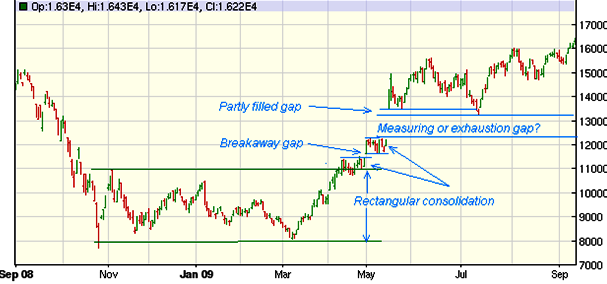
Breakaway gaps are usually revisited before too long. This simply means that the price will trade back into the void in the near future. If I were trading this position, I would want to use a stop order below or above the gap (depending on the direction of the break). This way I am avoiding a false breakout. Breakaway gaps usually appear at the beginning of a sustained move in the direction of the gap and are often the beginning of a new bull or bear market.
The second gap, known as a runaway or measuring gap, occurs in the middle of a trend, whether up or down, and is a sign of renewed strength. They appear in proximity to the mid-point of what will become the entire move. These particular gaps are difficult to spot but are important for projecting the length of the expected move. This gap does not have to qualify its origin by having a breakaway gap prior to its existence. It simply is identified by the fact that it occurs in the middle of a move as opposed to the beginning of the move.
This runaway gap is also a continuation pattern meaning that it will continue in the same direction of the trend. Runaway gaps have a unique quality in that they serve as a projection tool to measure the target price which is expected to be reached based on the measurement from the initial part of the move to the gap. This measurement is then projected in the same direction for an estimate of the new price target. Runaway gaps appear in both up and down trends and the rules for measuring are the same. If you are fortunate enough to have a breakaway gap prior to the appearance of the runaway gap, then your measuring parameters are simplified. You simply measure the distance from the breakaway gap to the beginning of the runaway gap and extend the measurement in the same direction to find your target price.
An easy method of identifying the measuring gap is when the gap occurs after a brief consolidation in price. Elliott wave patterns, or other technical chart patterns, such as triangles and pennants, provide key insight as to when to expect the appearance of a runaway gap. Usually such a move will be confirmed by an increase in volume, but this is not always the case.
Next month we will continue with the last two gap formations. •
Marty Hibbs is a 25 year veteran futures trader, analyst, and portfolio manager. Hibbs was a regular guest analyst on BNN for four years. He is currently a grain merchandiser with Grain Farmers of Ontario.
|
Lesson Definitions: Bull Market: A bull market is a period of generally rising prices. The start of a bull market is marked by widespread pessimism and usually ends with euphoria. |
DISCLAIMER: This information has been compiled from sources believed to be reliable, but no representation or warranty, express or implied, is made by the author, by Grain Farmers of Ontario, or by any other person as to its accuracy, completeness or correctness and Grain Farmers of Ontario accepts no liability whatsoever for any loss arising from any use of same.