Understanding precision agriculture
WHERE DO MANAGEMENT ZONES MAKE SENSE?
GROWERS MIGHT KNOW from experience that they have areas in their fields that consistently deliver high yields season after season — and other parts that just aren’t very productive at all.
But is having that knowledge enough for growers to optimize inputs and yield potential in each area of a field so that their overall profitability is higher and their environmental impact is lower?
This, say researchers from the Precision Agriculture Advancement for Ontario (PAAO) project team, is where creating management zones can help.
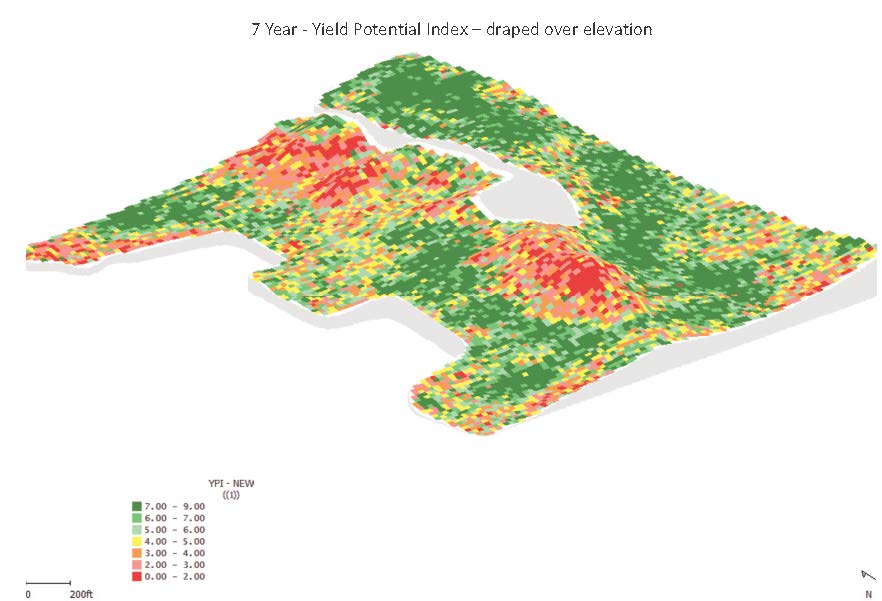
Management zones are areas within a field that have similar yield potential. However, this similar performance can be due to a variety of different reasons, including soil type, elevation and weather conditions within or between years.
Ian McDonald, applied research coordinator with the Ontario Ministry of Agriculture, Food and Rural Affairs (OMAFRA), says that management zones form the backbone of a precision agriculture site specific management approach to production, and serve as the foundation for optimizing profitability through other tools, such as prescription maps to tailor crop inputs.
The PAAO team is trying to better understand how growers should go about creating management zones, which types of data they need to collect, and how it should all fit together.
CREATING ZONES
Nicole Rabe, OMAFRA land resource specialist, explains that creating a management zone is based on three main buckets: what growers see — the knolls, depressions, and wet spots in their field landscape — what they can measure (soil texture, nutrients, and organic matter), and what they achieved in terms of high, average, or low crop yields. All this information is then taken together and mapped out to produce a management zone.
So where can growers get started? The first thing they may already be doing is collecting both yield and elevation data off of equipment.
McDonald says having multiple “layers” of data may help create a management zone that’s more accurate and reliable.
However, crunching the yield and elevation numbers and then performing the integrated analysis of the different layers to create a management zone can be complicated.
According to Rabe, there are no fully automated, easy-to-use methods for integrating all of the data layers together into a management zone map.
Often, multiple software tools need to be used, and then the grower must work with their agronomist or consultant to carefully look over the maps that were produced and decide on how to form their management zone.
Another problem is that the approaches aren’t transparent and don’t give growers a sense of what type of math or process is being used to analyze and integrate each data layer.
The PAAO team has also found that the same data layers aren’t always used to perform an integrated analysis of a field, as some layers may be more important than others depending on a given year’s weather and agronomic conditions.
TOOLS
Several precision agriculture computer tools (such as SMS, SS,T and Farm Works), or internet-based, integrated analysis services (such as XS Inc. and Ag Veritas) do exist and can be purchased. Niagara College is also developing the Crop Portal, their online data analysis tool as part of the PAAO project.
“We hope to get to a point in the project where we can present a streamlined, automated way for growers to perform an integrated analysis using the Crop Portal being developed by Niagara College as part of the PAAO project,” Rabe says.
McDonald recommends growers look to their crop advisors or an outside specialist for help with performing data analysis.
“Quite a few of the software tools available aren’t the most intuitive to use and require plenty of training to use properly,” says McDonald. “We’re getting into an era where farmers aren’t the jacks of all trades like they used to be — especially with things becoming more complex and computer-driven. Luckily, there are a number of advisors who specialize in making those tools work, and maybe that’s where you should be spending your dollar.”
Rabe points out that another big part of creating management zones comes from a grower’s own field-level understanding of their field’s agronomic features and issues.
McDonald adds that growers also need to pay attention to the parts of their fields with untapped productivity that that they may not have taken full advantage of before.
By matching up their yield and elevation data layers with their field-level agronomic knowledge, growers can use their management zones to pinpoint the areas of their fields that have the most potential for yield and then tailor their nutrient and seed inputs to these specific zones.
On the flip-side, management zones can also reveal less-productive areas that may benefit from more attention.
“You have to look at a field as an entire system where the goal is to optimize each management zone by matching your inputs to each zone’s productivity and profit,” explains McDonald. “Poorer producing areas may just need more management to actually make them profitable.”
ZONE AGGREGATION
Rabe and McDonald say that many growers — when mapping out their management zones — are “bundling” several zones together. For example, a grower’s data might show that there are 10 zones that could be managed across a field, but instead, they’re putting zones with similar characteristics together so that they only have three (or four) to manage.

Integrated Analysis (IA)
• Take all layers that spatially define management zones (MZ)
• Each layer should show very similar geometry & reinforce one another
• Each of the layers show different features of the field that indicate crop performance, soil variability, & how water moves across the field
• Current status: IA is sometimes semi-automated, but is rarely a hands-off fully automated process In Ontario
Checks & balances with MZ:
• If a grower doesn’t know a field very well, verification & agronomic testing is needed
• If a grower knows a field very well, then integrated analysis should result in a MZ map that is very familiar to what they “see” on the soil ag landscape and in their crop performance year after year
Project Goals:
• We began with YPI as the standard approach – but collected all data layers on all 25 fields in Ontario
• Should each layer be weighted equally?
• What does a grower gain from adding multiple layers of information into MZ creation by integrated analysis?
• What are the costs and benefits of this multiple layer approach?
“Quite often, the subtle changes between zones makes for a very small area to manage,” says Rabe. “And it can be difficult to hit those fine isolated little pockets with equipment depending on the layout of the field.”
She also points to the limitations of current equipment as another main reason for management zone aggregation. Right now, most growers can only handle managing so many input rates across a field at one time.
Why is this important? According to McDonald, growers aren’t getting the same level of detail — or resolution — from a combined management zone as they would if they were using every management zone.
“This is an important concept, because when we bundle zones together, it really does impact how much we can optimize the inputs to the overall productivity potential of that aggregated zone,” he explains. “But as we move towards having precision equipment as well as the level of understanding needed to manage in greater detail, or higher resolution, the opportunity to optimize every zone will be enhanced.”
He adds that while combined or “aggregated” management zones are better than the “whole field” management approach that’s still in use today, the PAAO researchers still have a long way to go.
Rabe, McDonald, and the rest of the PAAO research team want to find out whether or not collecting and including other more detailed data layers — such as soil chemistry, soil texture, and electrical conductivity — can improve the reliability and accuracy of a management zone. Also, if other data layers are added, do the transition areas between management zones change, shift or stay the same with every year?
“That’s still a big question for us: how stable are management zones from year to year?” says McDonald. “That’s why we want to look at adding other data layers to the mix and find out whether the imaginary lines between the management zones in your field change.”
This project was funded in part through Growing Forward 2 (GF2), a federal-provincial-territorial initiative. The Agricultural Adaptation Council assists in the delivery of GF2 in Ontario. •
Precision Agriculture Advancement for Ontario: This article is part of a series dedicated to helping farmers understand and implement precision agriculture technology. It is based on research conducted by Nicole Rabe, Ian McDonald, and Ben Rosser at OMAFRA, in conjunction with Mike Duncan,?Sarah Lepp, and Gregor MacLean at Niagara College. For more on precision agriculture go to: www.gfo.ca/Research/Understanding-Precision-Ag.