Understanding precision agriculture
PRESCRIPTION MAPS AND VALIDATION
THIS ARTICLE IS the ninth in a series intended to introduce and explain the concept of management zones and to outline the kinds of data and computer tools used to delineate and characterize management zones (go to www.gfo.ca/research/ precisionag to read previous articles).

Previously, we discussed the integration of various data layers (i.e. elevation, terrain attributes, absolute and normalized yield maps, soil attributes, and imagery) to fabricate a map of soil based management zones for a field located near Guelph, Ontario.
The same cash crop field will be used as a case study to show a number of site specific management options that the producer has opted to use in preparation for the 2016 corn crop. For this case study, the producer decided to use the detailed soil type map and the absolute yield (bu/ac) map. Recall that a number of map type products are made in the process of making a soil based management zone map and many of them may be used as standalone zone maps.
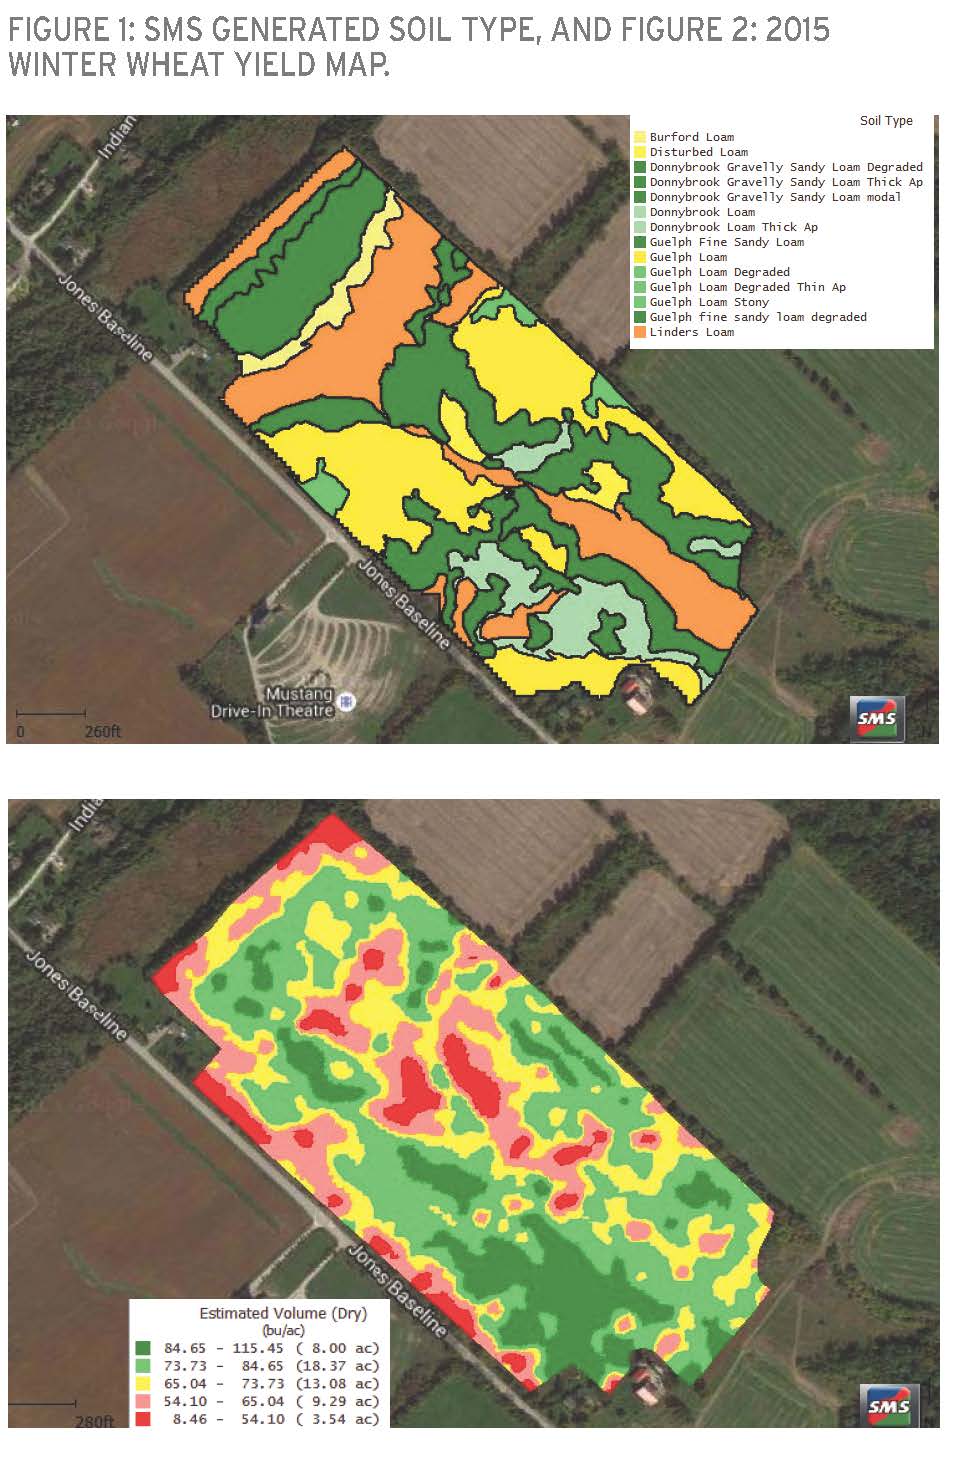
The producer and the authors discussed site specific management options based on the soil type map for tillage, variable rate nitrogen, and population. The absolute yield map was used to derive a potassium application map. Each of these prescription application maps will be discussed in the sections below. Figures 1 and 2 show the detailed soil type map and the absolute yield map (bu/ac) for the 2015 winter wheat crop. The SMS software was used to generate these as prescription maps.
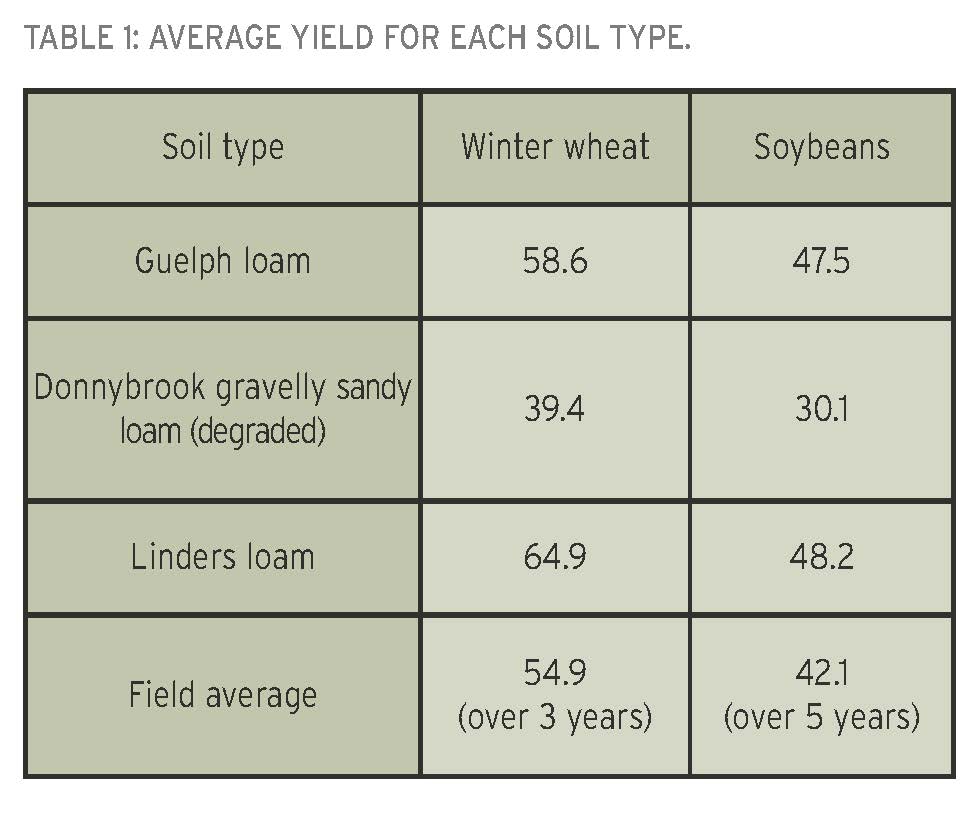
Table 1 represents the yield average of soybeans and winter wheat in years when the field was being managed as a single unit.
TILLAGE PRESCRIPTIONS
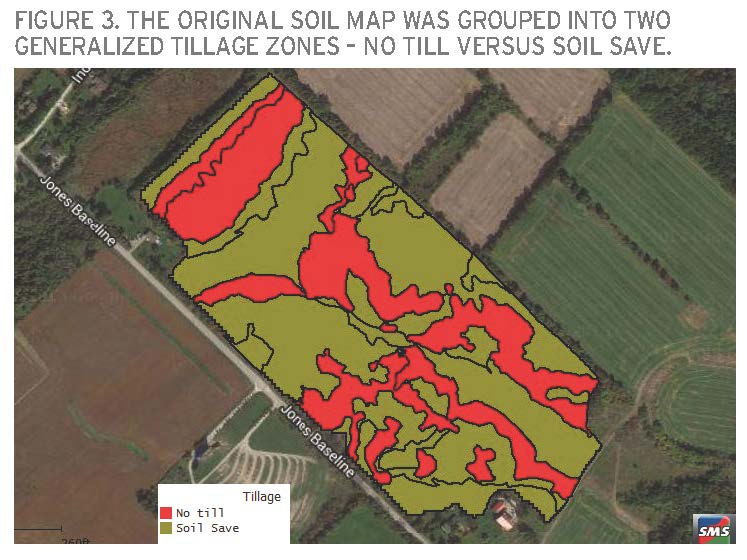
The producer generalized the soil type map Figure 1 using his knowledge of the field as shown in Figure 3 as the basis for the differential application of tillage spatially.
The producer is concerned about the condition or soil health of the Donnybrook soil type (red areas Figure 3). This is a very droughty soil whose soil profile has been impacted by tillage and soil erosion due to its steep slopes and soil properties. Only two to three horizons are observed — Ap, or Apk over a Ck, and occasionally a thin (two to four centimetre) Bt horizon. Evidence of degradation includes thin topsoil and low per cent organic matter, high topsoil pH, free carbonates in the topsoil, and lots of cobbles and stones on the surface. This soil also tends to consistently produce below average yields.
In an effort to preserve and improve the soil health of the plow layer, the producer has decided that the Donnybrook soil and its phases will be managed permanently with no-till. A red clover crop is currently growing in the field. The clover will be killed with a glyphosate/ dicamba burndown. A soil saver will be used to partially incorporate the wheat straw and clover residue and to remove subsoil compaction. The soil saver will only be used on the higher yielding loamier soil types (brown areas Figure 3). In the spring, the no-till areas continue to be no-till even after potassium application.
POTASSIUM PRESCRIPTIONS
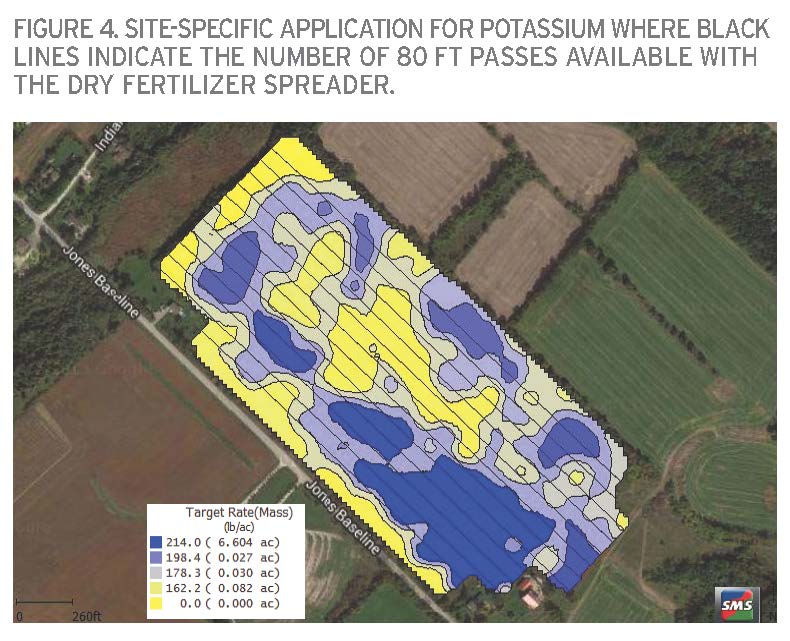
The prescription map is generated from the Figure 2 yield map and the values assigned to the map are based on corn predicted crop removal values for estimated yield in those zones as per IPNI numbers (http://www.ipni.net/article/IPNI-3296). In this case, the producer uses SMS software in which you can assign a formula for the calculation of the application rates by zone and yield estimate. Figure 4 shows an example of using the wheat yield map from last year, to adjust the potassium prescription for the coming corn crop. More product is applied based on higher wheat yield areas (blue areas on the map) and less potash is applied on lower yielding zones (yellow areas on the map) The formula run was quite simple:
Application Rate lbs/ac = (Dry bu/ac) * 1.54 * 1.62
Note: Application rate = Dry bu/ac * (Wheat Grain and Straw Crop Removal Rate, lbs/bu of k20 removed IPNI removal rates) * (Actual Analysis of fertilizer product +1)
The fertilizer spreader is able to adjust application rate on the go to make the changes indicated by the map which is loaded into the display (computer) that then connects to the controller of the applicator. The order of operation will likely be a single pass in the fall tilled area, followed by application of potassium spatially, and then a second cultivation to create the seedbed for planting.
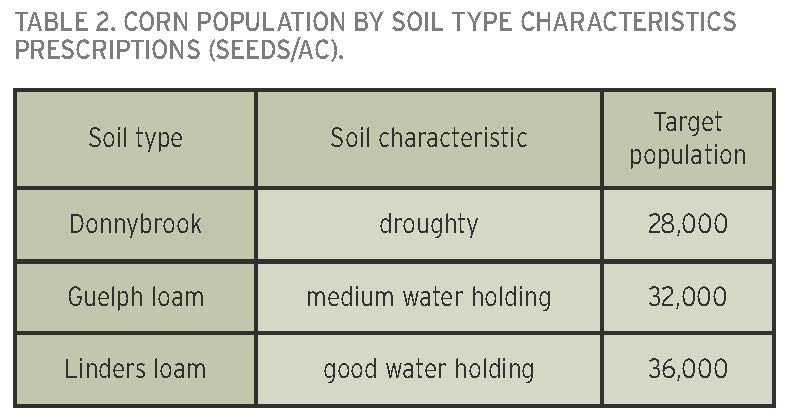
POPULATION PRESCRIPTIONS
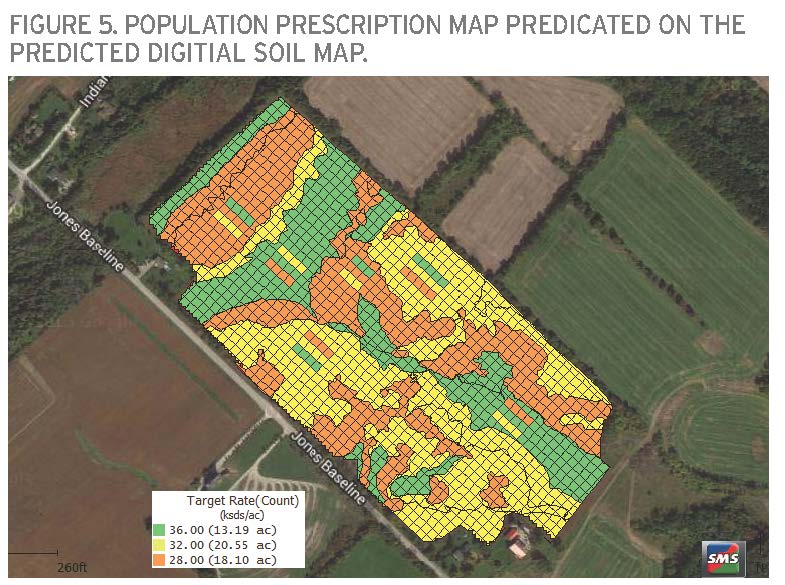
The producer has decided that population is important to vary by zone because yield potential centred on moisture holding capacity can be exploited as suggested by Table 1. The soil types of this field have been grouped to create three zones for variable populations (Table 2). The population map is made at increments of 4,000 plants/ac between zones. You need enough of a seeding rate change to detect yield response differences across the field and the management zones. Note in the prescription map that there are small blocks of additional population rates within each main management zone (Figure 5). This allows validation of what the real population should have been prescribed for the management zone. This also allows for yield analysis of three different rates in the same management zone, and helps to determine the optimal corn population in a given growing season.
VALIDATION OF PRESCRIPTIONS
The purpose of the validation blocks is to test the validity of the zone target rate (which can be any crop input such as seed or fertilizer). Validation blocks or strips can be added to the prescription maps to explore whether management zones and their accompanying prescriptions for input rates are correct economically. In the variable rate population case (Figure 5) the individual squares are 40 x 40 feet to match the width of the planter. Since this would only result in eight to 12 yield points being collected within that area, a series of these small blocks are stacked to increase the number of yield points collected at harvest time. There is a transition time as input rates are changing, so the validation blocks/strips must be long enough to ensure that there is enough clean yield points collected. The orientation of the validation blocks is also arranged to the direction of equipment travel so that the yield data collected is as accurately as possible within a treatment block or strip.
There should be a minimum of a couple replicates of these validation blocks/strips within or across the field. Validation blocks/strips should avoid headland or field edges. Yield monitors need to be calibrated for crop type and moisture content. This can usually be done on fields close to the home farm where scales are available. AgLeader SMS and other software tools can be used to add these validation blocks/strips to prescription maps.
A second approach is a manual on-the-go method. Here, the operator would have the applicator or planter controller set with a few pre-programed rates that could be toggled on and off. If you are doing field length strips, then you toggle on the desired flat rate in a couple of places in the field, avoiding the field edges and headlands. If validation blocks are to be used, the farmer needs his management zone map on the screen so that he can see where there are places he can toggle on and off the desired flat rate. The “as-applied” maps show where these rates were applied and should be downloaded off the display at the end of the planting or application season. This as-applied map is used in conjunction with the yield map at the end of the growing season to determine which rate had the most economical yield response.
SUMMARY
We will follow up in 2016 with an article on how the variable rate management went on this Guelph field. The authors hope this precision agriculture series helped to inform and educate readers on the fundamental data gathering and analytics principles for building stable, reliable management zones. This is a process and it can take a few years to formulate a stable decision support system around each precision agriculture field strategy. A concerted effort was put forward to present both introductory steps and more advanced steps to creating management zones that stand the test of time. As we head into the dead of the winter, we hope those readers who are “precision ag fence sitters” get off the fence and try something new in the way of variably managing their crop inputs that take advantage of the equipment they may already have on their farm. There are both known economic and environmental benefits to practicing more well-rounded (beyond driving straight!) precision agriculture strategies on the farm.
Woodrill Farms contributed to the research and development of maps used in this article. •


