Looking back at the 2010 corn crop
EXAMINING THE VICTORIES AND CHALLENGES OF 2010
bask in the high yields, adjust for the lessons learned or agonize over the unresolved questions – the 2010 corn season provides some excellent grist for the mill.
high yields
With 95 percent of the corn yields reported to Agricorp (as of Dec. 20, 2010), the provincial average corn yield came in at 172 bushels per acre for 2010. This is clearly a new record and after all the dust settles, it will have passed the last high yield mark, set in 2008, by as much as 10 bushels per acre. The corn yield trend line continues to impress with yields increasing at about two bushels per acre per year.
| Location | 1990 Highest Yield | 2010 Highest Yield | 1990 Average Yield | 2010 Average Yield | Improvement in Average |
| Elora | 140 | 248 | 117 | 211 | 80 % |
| Ridgetown | 179 | 317 | 156 | 271 | 74 % |
2010 was also the first year that yields over 300 bushels per acre were recorded in an Ontario Corn Committee (OCC) Hybrid Performance trial. It occurred at the site on the Ridgetown Campus and four hybrids actually laid claim to the plus 300 honours. Now I realize that some of you may complain that those are small plots, hand thinned and the results are unreasonable for real farm situations. Those points are valid but the excitement in terms of yield improvement is when you look at the change in those same small plot trials over the past 20 years. Table 1 (below) illustrates the differences in corn yield at Ridgetown and Elora OCC performance trials between 1990 and 2010.
If there is a sobering thought here for producers it lies in the question – are my yields keeping up? There are three factors that influence these evolving corn yields: genetics, agronomics and environment. Although there is not much you can do about the last one, this winter is certainly a good time to evaluate if your hybrid selection and agronomic practices are keeping pace.
early season developments
April weather was abnormally warm and relatively dry resulting in perhaps the best soil conditions and earliest corn planting ever experienced in the province. It is estimated that between 80 and 90 percent of the corn was planted by May 5. Early planting and warm conditions resulted in much of the crop emerging in late April or early May and effectively added 150 crop heat units (CHU) to the season. London for example, accumulated 3404 CHU from May 1 to season end, but for growers that planted in mid-April the effective CHU total for those areas was closer to 3550. That of course is one of the advantages to the new heat unit map which is based on CHU accumulation with a common start date of May 1 across the province. Producers can make relatively easy calculations as to what 10 days either side of May 1 does to expected CHU accumulation. 2010 added another brick to the monument for the value early planting. At the replant trial at Elora, late May corn at 180 bushels per acre looks pretty good until you compare it to late-April corn at 219 when averaged across six adapted hybrids.
western bean cutworm
Western Bean Cutworm (WBC) continued to be a significant and growing concern across many areas in 2010. The number of counties where the WBC moths were trapped increased and moth numbers increased dramatically compared to previous years in some counties (see www.cornpest.ca for WBC trap counts in your county).
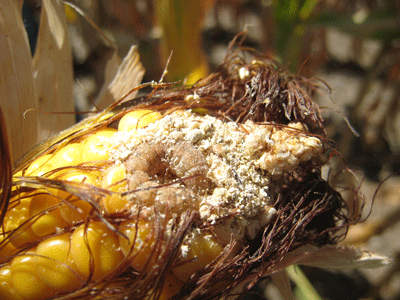
photo courtesy Tracey Baute
In isolated areas the presence of egg masses and larvae reached the threshold where control was required. In very isolated areas the insect feeding was significant, to the point that if no control measure was in place – either genetic protection or insecticide application – grain yield losses were significant.
Some of the key lessons learned:
• Very high numbers WBC moths caught in traps often meant nothing when it came to actual yield loss
• Sandy soils tend to be more prone to WBC challenges than heavier soils
• To a great extent, WBC moths avoid laying eggs in corn that has tasseled, hence late planted (not tasseled) corn was much more prone to damage from WBC larvae.
Growers will need to evaluate their risk, make sure they understand the options for genetic control and continue to stay tuned into the WBC issue.
soil potassium (k) decline
A survey of soil test levels was conducted in 2010 by the International Plant Nutrition Institute and it highlighted the decline in soil test K levels in many parts of North America including Ontario. Some of our recent starter fertilizer work funded by the Grain Farmers of Ontario has also drawn attention to potash management for corn. 2010 was the third year where we examined starter fertilizer options on sites that included a range of phosphorous (P) and K soil test values.
The results were not unlike what we had seen in previous years. On soils that ranged from 60 to 80 parts per million soil test K, starter fertilizers that contained potash often were the clear yield winners compared to starters that contained none or very small amounts of K. At the Elora site, which had a K soil test of 75 PPM, for the third year in a row, broadcasting 200 pounds per acre of 0-0-60 still did not eliminate the need for K in the starter to optimize yields. On lower testing soils, the research indicates that proper K management can easily result in a 10 bushel per acre increase in yields; at $ 4.73 per bushel it is worth chasing.
nitrogen (n) recommendations based on yield
Over the past decade there has been considerable research and discussion over the validity of N recommendation systems that contain a yield expectation component. In fact, many of the US states now employ a recommendation system, based on a considerable body of research, that ignores yield expectation. This system for the most part replaced older systems of multiplying yield expectation by some constant (e.g. 1.2 pounds of N per bushel) then subtracting credits for crop rotation or manure.
During this time, the Ontario Corn Nitrogen Calculator was also developed. Ken Janovicek from the University of Guelph carefully examined over 40 years of Ontario research and concluded that yield expectation was still a valid component in an Ontario based system. It certainly did not explain everything, but was part of a system that attempted to identify the most profitable N rate in corn production.
We are confident that the N Calculator is more robust than taking your high yield number and simply multiplying it by some constant. However, we are the first to admit that in developing the N Calculator we didn’t have a lot of 210 bushel yields in the database to work with. Some additional considerations for N recommendations in the high yield world:
• Are new hybrids more N efficient than older hybrids and thus require less N per bushel produced?
• Do high yield years (warm and adequate rainfall) also tend to be the years when soil organic matter pumps out more available nitrogen thus helping to match the crops requirements without additional fertilizer?
Although N recommendations may fall into the “agonize over” category of the 2010 season and Western Bean Cutworm management falls in the “lessons learned” section of the year, it is clear we can bask in the high yields of the past crop year and look forward to 2011. •


