Opportunity
ONTARIO’S CORN, SOYBEAN AND WHEAT MARKETS
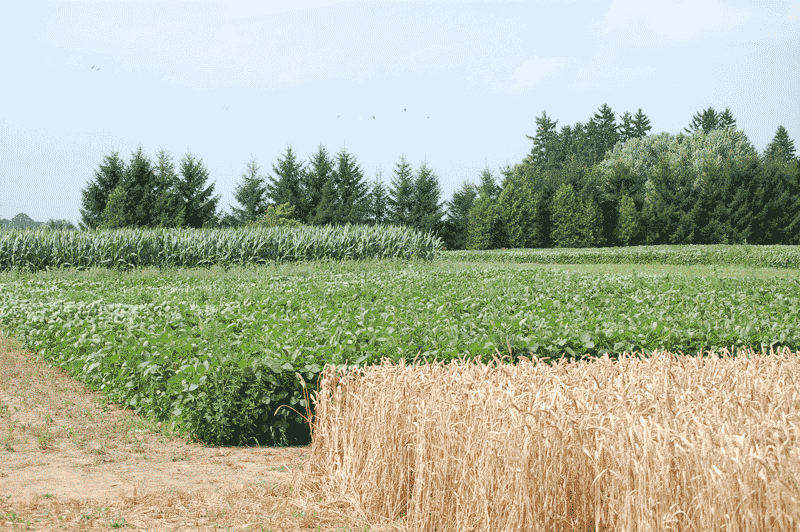
in ontario, grain crops cover 5.5 million acres of farmland and generate $3 billion in farm gate receipts. These are impressive numbers, but there is still room for growth. A review of the current corn, soybean and wheat markets shows us the opportunities that exist in a global marketplace.

“These statistics provide an important snapshot of the current market environments for our commodities,” says Crosby Devitt, Manager, Research & Market Development for Grain Farmers of Ontario. “Knowing where our grain is going, and understanding how it is being utilized, allows us to see emerging markets where new opportunities may be available.”
Domestically, we are providing quality grain to millers, processers, and bio-energy facilities. Over the years, producers have adapted to the needs of these end users. For example, up until 1997, Ontario was growing only Soft White winter wheat and Hard Red winter wheat when Soft Red winter began to be produced. Since then, Soft Red winter has continuously increased in acreage and for the past five years it has been the dominant variety for producers to grow. This transition has resulted in competitive soft wheat varieties for the domestic market and has also put Ontario in a more effective export position.
The world market is constantly evolving with new opportunities opening up due to changes in trade policies or the influences of supply and demand in any given region. This can be tracked through how much grain other countries are producing and how much they are importing.
“At Grain Farmers of Ontario, the Market Development team uses this information to direct our resources towards exploring the details of potential markets and the best approach for entering into them,” explains Devitt. “We also help to promote Ontario grains within these new markets.”
Producers can use this same information to gain a better understanding of our industry and where they might find future opportunities.
corn
Canada is the tenth largest corn producing country in the world. On average, Ontario produces 65 percent of the total corn grown in Canada. The remainder is grown in southwestern parts of Quebec and increasingly more acres are being grown in Manitoba.
TABLE: 2012 ontario corn exports, top 5 export regions, source: statistics canada, 2012; aafc calculations, 2013.
| Country |
Volume (MT) |
| United States | 513,834 |
| Hong Kong | 516 |
| United Kingdom | 114 |
| France | 18 |
| Chile | 6 |
| Total Overall Exports | 514,489 |
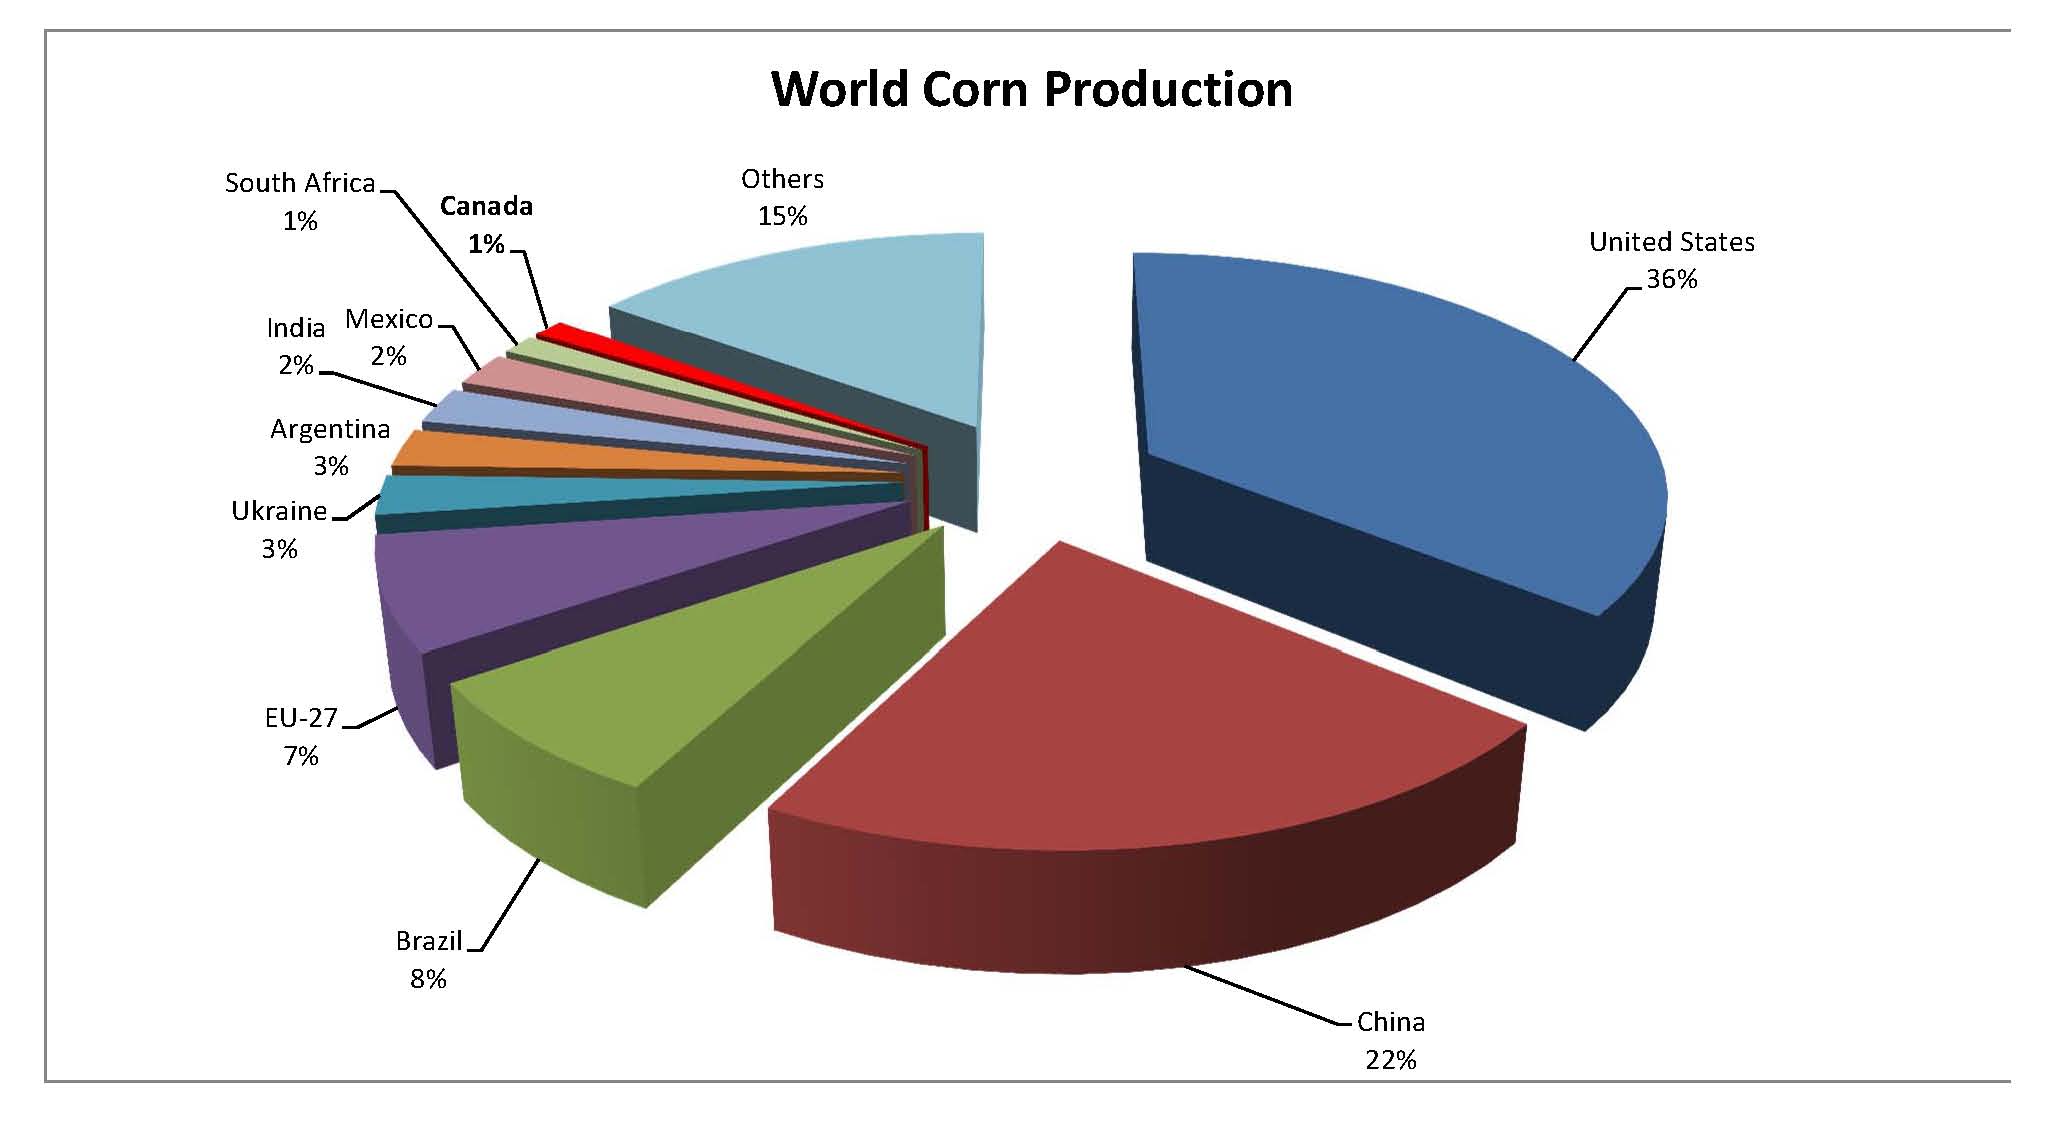
GRAPH: WORLD CORN PRODUCTION, SOURCE, USDA.
In 2012, 2.2 million acres were harvested in Ontario which resulted in nearly 340 million bushels of corn (8.6 million MT). The average farm yielded 153.2 bushels per acre. That was slightly above the five year average.
Approximately 40 to 50 percent of corn is used in food and industrial applications. One of the biggest domestic users is Ingredion (read more about the company, formerly known as Casco, on page 14), however, the spirits industry is also a large purchaser of Ontario corn. Collingwood Whisky, Wisers, Candian Club, Gibsons, and Crown Royal are some of the quality Canadian whiskies your corn is used to produce.
The remaining 50 to 60 percent of corn grown in Ontario is used as animal feed, mostly in the dairy, beef and hog industries.
Corn exports are made to between five and 22 different markets each year.
Corn exports to all markets increased by approximately 49 percent between 2008 and 2012. On average, we now export more than a million metric tonnes (MT) of corn every year.
Even though the United States is the largest corn producer in the world, they imported more than half a million metric tonnes of Ontario corn in 2012. That accounted for nearly all of our total corn exports. This was likely due to the impact a widespread drought had on yields in top US corn producing states.
soybeans
More than 2.5 million acres of soybeans were harvested in Ontario last year with approximately 25 percent of the crop non-GM. Quebec, Manitoba and Prince Edward Island are the other main soybean growing regions in the country. Saskatchewan producers are beginning to experiment with growing soybeans. It is projected that in 2014 they will seed more than 300,000 acres.
TABLE: 2012 ontario soybean exports, top 5 export regions, source: statistics canada, 2012; aafc calculations, 2013.
| Country |
Volume (MT) |
| Japan | 236,120 |
| Netherlands | 223,795 |
| Belgium | 141,971 |
| Untied States | 116,269 |
| China | 111,983 |
| Total Overall Exports | 830,138 |
GRAPH: WORLD SOYBEAN PRODUCTION, SOURCE, USDA.
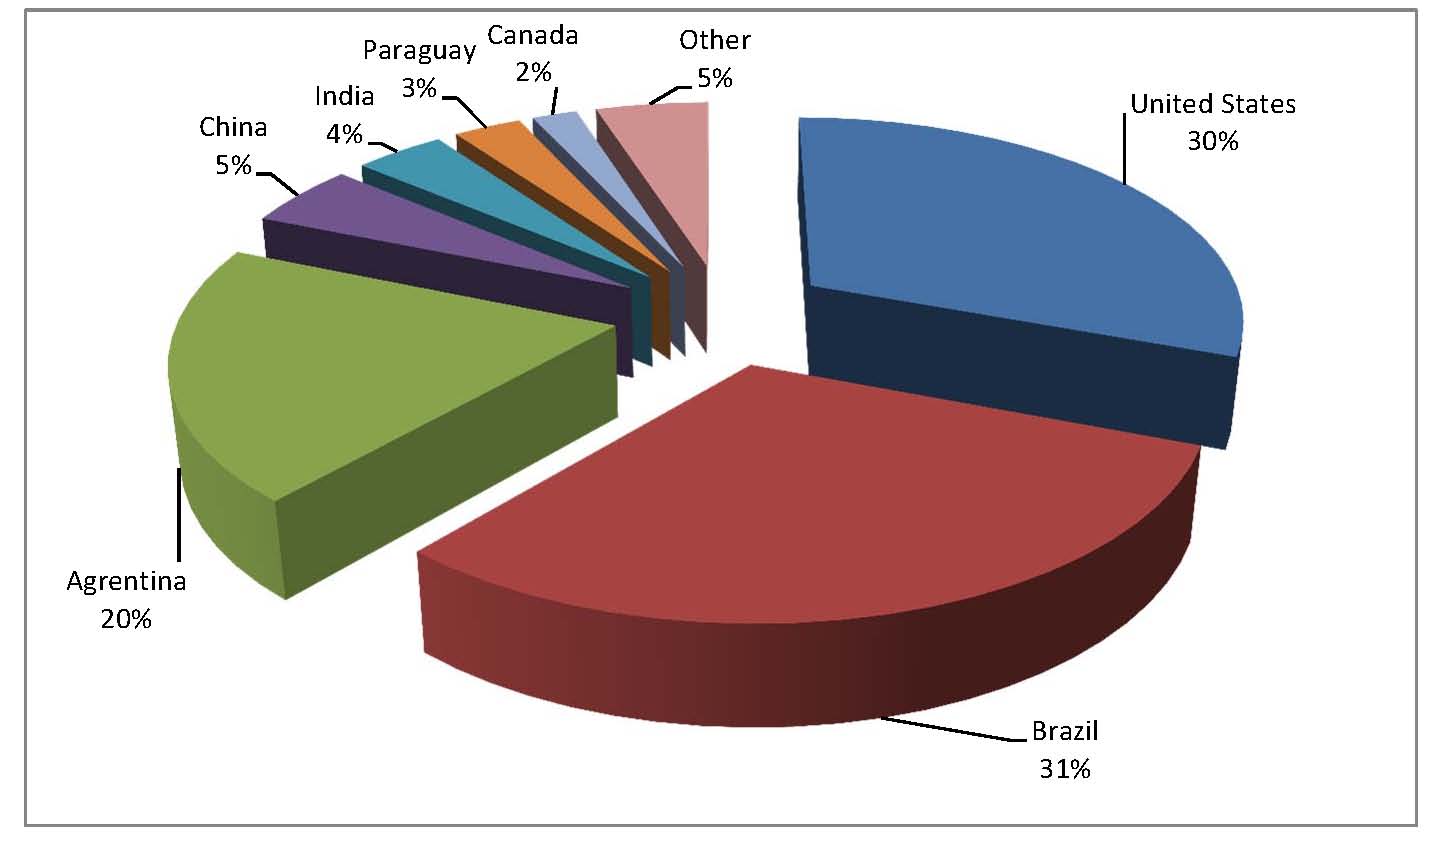
Ontario grows 67 percent of all soybeans produced in Canada – an amount equal to 3.27 million MT. Last year, Ontario producers averaged 46.5 bushels per acre, well above the five year average of 41.5 bushels per acre.
Soybeans were the top agri-food export for Ontario in 2012 with a value of more than $842 million. They were also the fourth largest agri-food export for Canada behind canola, non-durham wheat and canola oil.
The demand for our soybeans has increased substantially since 2008, particularly within the Asian market. Japan has been our biggest customer, importing (on average) more than 217,000 MT of Ontario soybeans per year. However, the Netherlands, an important gateway into the European Union market, has been increasing shipments in recent years – even surpassing the total volume of soybeans imported by Japan in 2010.
Approximately 75 percent of soybeans are used for the crush market which includes edible oils, biodiesel and soymeal processors. Canada produces an average of 110 million litres of biodiesel per year. A two percent federal biodiesel mandate is currently in place and Grain Farmers of Ontario is actively working to secure a provincial mandate which would increase the demand for provincially sourced soybeans.
The growth of the renewable fuels industry over the last several years, and especially that of ethanol, has led to a rise in the use of dried distillers’ grain, a by-product of ethanol production. This has changed the domestic use of soybean meal in Canada by considerably reducing the usage by ruminant animals such as cattle and sheep.
However, soymeal is still the most common protein meal in the world and it is also the most consistent, high-quality protein source available for feed. Over half of the soymeal produced in Canada is used by the poultry industry, followed by the swine and dairy industries. More than 90 percent of the soymeal produced in Canada is processed at facilities in Hamilton and Windsor.
The other market for Ontario soybeans is the Identity Preserved (IP) food grade market. These soybeans, which garner a premium for producers, are used to make tofu, soy beverages, natto, and miso in Asian markets.
wheat
Approximately 17,000 producers plant wheat into their rotation each year. Sixty-five percent grow Soft Red winter, 15 percent grow Hard Red winter, 10 percent grow Soft White winter, and 10 percent grow Hard Red spring. In 2012, winter wheat yielded an average of 78.4 bushels per acre compared to 55.1 bushels per acre for spring varieties. This produced a total of 1.75 million MT of winter wheat and 133,000 MT of spring wheat.
TABLE: 2012 ontario WHEAT exports, top 3 export regions, source: statistics canada, 2012; aafc calculations, 2013.
| Country |
Volume (MT) |
| United States | 51,863 |
| Untied Kingdom | 1,088 |
| Montenegro | 20 |
| Total Overall Exports | 52,971 |
GRAPH: WORLD WHEAT PRODUCTION, SOURCE, USDA (THOUSAND METRIC TONNES).
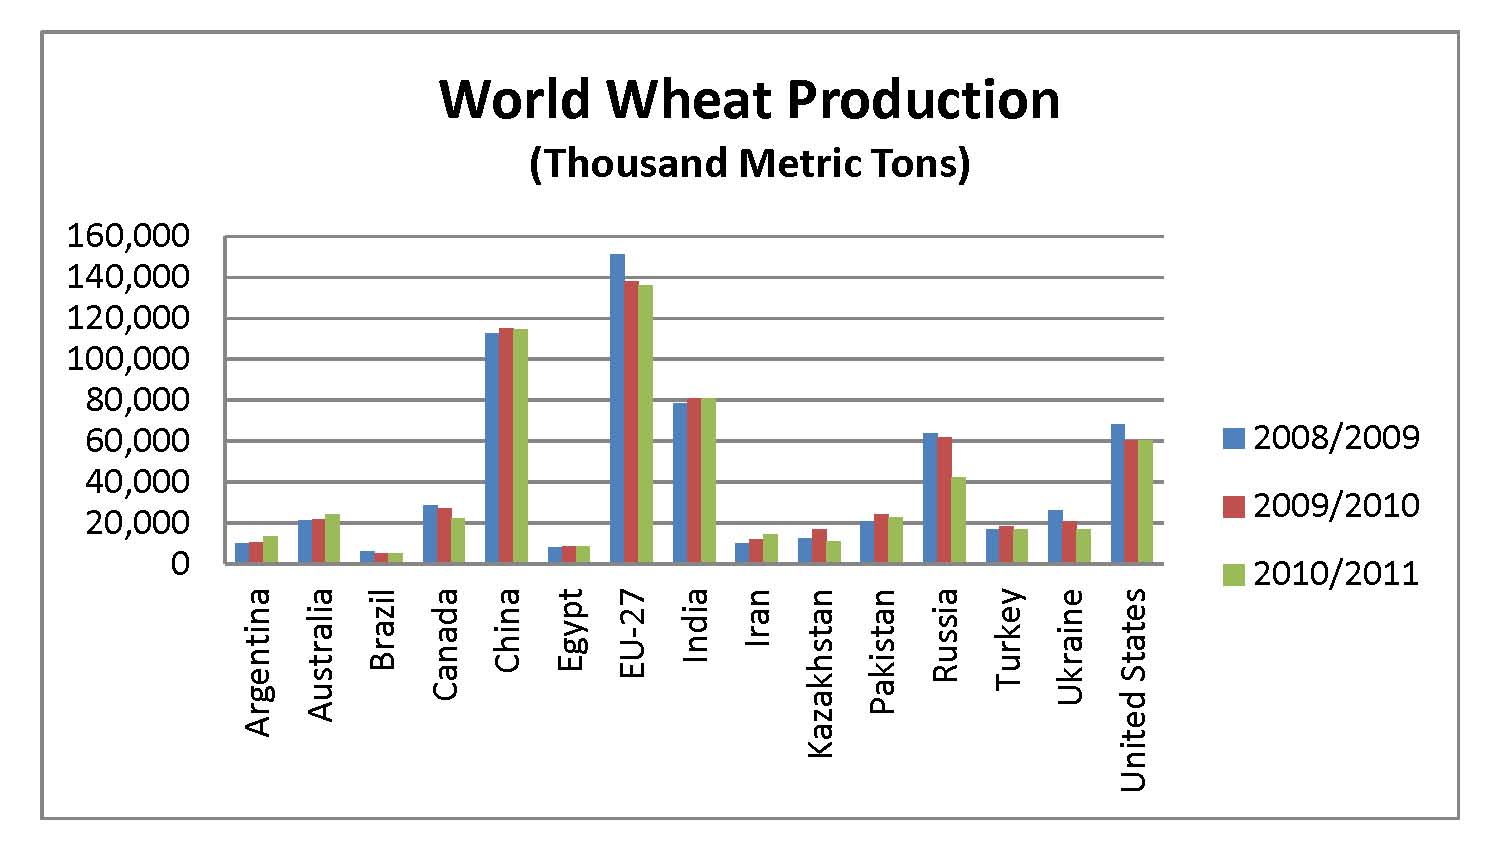
Canada is the third largest wheat exporting country, exporting an average of 17.5 million metric tonnes each year. This is about half of the volume exported by the US. On the world market Canada also competes with the European Union, Australia, and Russia. Russia placed a temporary ban on wheat exports in 2011 due to low domestic supply; however, since it was lifted they have once again become one of the top exporters.
Despite being a major exporter themselves, the US is the top destination for Ontario wheat. In particular, nearby markets within the Great Lakes’ basin are a strong destination for soft wheat grown in Ontario.
Domestically, mills process more than three million metric tonnes of Canadian wheat every year. Seventy-five percent of this wheat is from Western Canada. The majority is turned into flour and other milled wheat food products; a small portion is sold as ‘mill feed’, a by-product used in the manufacturing of animal feeds and pet foods. In Ontario, half of the wheat produced is milled domestically, 25 percent becomes food grade exports and 25 percent is used as livestock feed. •


