Farmland price update
FACTORS AT PLAY AND THE OUTLOOK FOR 2016
WHILE FARMLAND PRICES increased substantially in 2014, the market cooled this year and that trend is expected to carry into 2016.
The ‘Farmland Values Report,’ published by Farm Credit Canada (FCC) in April 2015, states that Ontario farmland values increased an average of 12 per cent in 2014, which is a little less than the 16 per cent increase of 2013 and substantially less than the hefty 30 per cent in 2012. The report states that low interest rates last year, coupled with the fact that in several areas of the province demand for farmland significantly outweighed supply, contributed to price increases.
There were wide variations in farmland prices in southern Ontario in 2014, says Brady Deaton Jr., a professor in the department of Food, Agriculture and Resource Economics at the University of Guelph — from as little as $4,000 per acre to a whopping $20,000 per acre.
Steve Duff, the Ontario Ministry of Agriculture, Food and Rural Affairs senior economist, also points out that the 2012 and 2013 spikes in grain and oilseed prices helped boost farmland prices in the province in those years and into 2014.
In terms of who is looking to buy farmland, FCC lists owners of large intensive livestock operations as one of the major players, who want more farmland for both manure management and cropping.
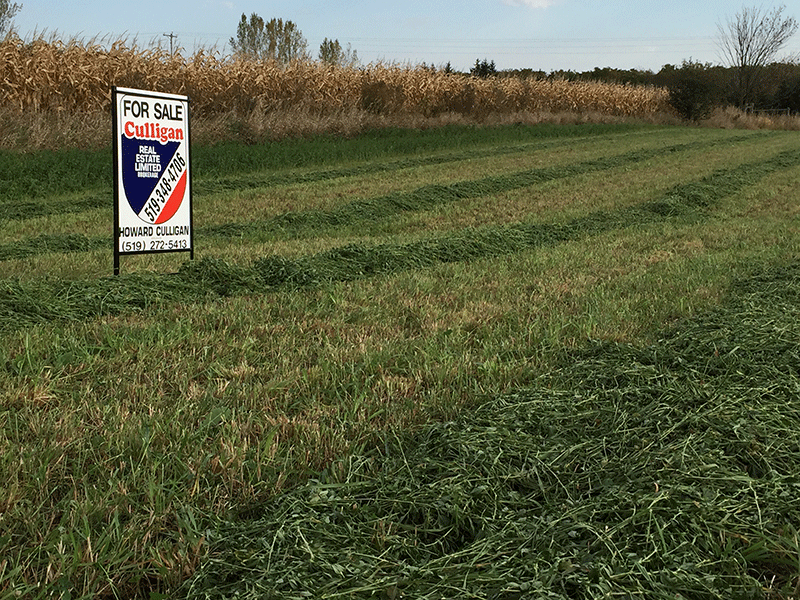
Howard Culligan agrees. “Land prices in core areas with high livestock densities, such as Perth, Oxford, Middlesex, and Huron saw the greatest farmland price increases last year,” says the broker at Culligan Realty in Mitchell. “This was mainly because of the multi-use factor as opposed to just cash crop single use.”
FCC lists two other groups — non-agricultural buyers and crop farmers — as those most interested in buying farmland. “Farmland in southern and central Ontario continued to be in high demand [in 2014], due to the availability of soil types that support high value crops,” the report states.
Producers in eastern Ontario also looked to expand, purchasing land in the immediate area and in neighbouring areas as well. However, the price of farmland in both the eastern and northern regions of the province rose last year, notes FCC, as buyers from high-priced areas in southern and southwestern areas searched these areas for possible farmland purchases.
FACTORS CURRENTLY AT PLAY
“Generally speaking, the recipe for high farmland prices is to mix high future expectations for the net returns of farming with low future expectations of interest rates,” observes Deaton. “The recipe for a less-enthusiastic outlook for farmland prices is to lower or maintain expectations of net returns and/or raise expectations regarding interest rates.”
He points to location and land quality as two other hugely important factors affecting farmland prices these days — especially location. In southern Ontario, extremely high farmland prices are often found near major urban areas where people may have an eye on using land for uses outside agriculture.
Duff notes that the availability of land is another factor in prices, one that doesn’t receive enough attention in his opinion.
“The majority of farmland never goes up for sale, so it’s a matter of how much becomes available each year,” he says. “Farmers with small and medium parcels they have been holding onto may decide to sell because the price is good, so that means there is more supply, which in turn tempers the price, some years more than others.”
Culligan points to two other factors that will continue to boost farmland prices: demand for land from recent immigrants to Canada over the past 20 years and the continued evolution of new technologies in agriculture.
“With new crop genetics, improved management techniques, and more sustainable farming practices, the profit potential of farming has grown substantially,” he notes, “and this will definitely continue to be a factor going forward.”
OUTLOOK FOR 2016
Deaton believes interest rates have essentially bottomed-out and that expectations about the future of commodity prices are lower than those held by buyers two to three years ago. “So, I expect farmland values and rental rates will start to flatten out,” he says. “Obviously in some areas they may increase slightly and in other areas decline slightly, but I would be surprised to see rapid appreciation of farmland values in 2016.”
The greatest determinant of how much farmland prices will go up in 2016, in Duff’s view, is how much farmland will be available. “There is also competition between grain and oilseed farmers and livestock producers for land,” he adds.
J.P. Gervais, FCC’s chief agricultural economist, could not provide comments for this story due to the occurrence of the federal election campaign at the time of publication, but observed earlier this year that interest rates will eventually increase, and that expanding world stocks of grains and oilseeds could bring farm profits down, and both will temper farmland prices.
Culligan’s outlook for 2016 is the same as it was for 2015. “Prices will be stable with some upward pressures in certain areas,” he says. “The quota policy announcement from the federal government before the election regarding the Trans Pacific Partnership trade agreement has been favourable and shows support for supply management. This provides confidence for future land investment and prices will continue to increase.” •
CANADIAN FARMLAND PRICE INCREASES
(taken from The ‘Farmland Values Report’ published by Farm Credit Canada in April 2015)
- The average value of Canadian farmland increased 14.3% in 2014, following increases of 22.1% in 2013 and 19.5% in 2012.
- The overall average values have continued to increase in the country since 1993.
- Saskatchewan experienced the highest average increase at 18.7%, followed by Quebec at 15.7%, Ontario at 12.4%, and Manitoba at 12.2%
Other average increases:
• Prince Edward Island 9.3%
• Alberta 8.8%
• New Brunswick 8%
• Nova Scotia 7%
• British Columbia 4.2%
• Newfoundland and Labrador had no change for the fourth year in a row


