How crop canopies affect aerial swath width
AGRONOMIC INFORMATION FROM ONTARIO'S CROP SPECIALISTS

Agriculture, Food and Agribusiness
Tar spot is a fungal disease caused by Phyllachora maydis and is becoming a significant economic concern in Ontario. Left unchecked, the disease causes rapid, premature leaf senescence. This reduces photosynthetic capacity and, ultimately, yield.
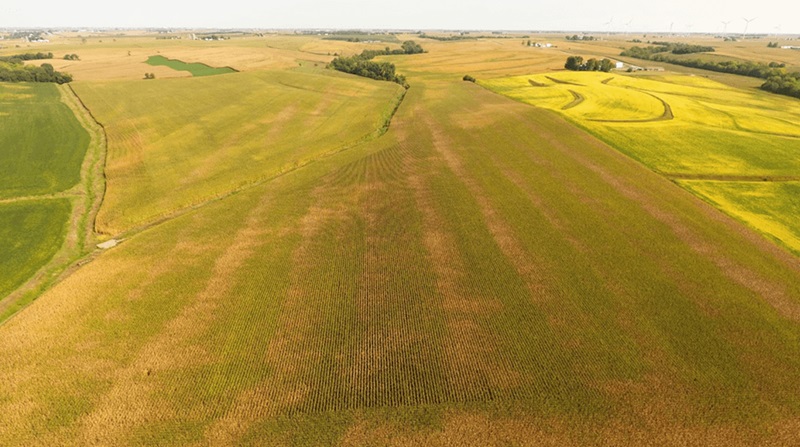
In the last few years, there have been several reports (both in Ontario and in corn-producing U.S. states) of tar spot “striping” following aerial sprays. Crops seem well protected directly beneath the flight path (green and healthy), but efficacy tapers to failure towards the edges of the swath (brown and desiccated). Fundamentally, this is likely due to inadequate spray coverage caused by an overestimation of the effective swath width.
A swath’s effective width presents the lowest variability while minimizing the degree of over- and under-dosing. As a matter of operational productivity, wider swaths are attractive because they mean fewer passes and faster applications. It is plausible that inappropriate swath widths from aerial applications are common but have not always been detected because:
- Generally, fungicides are weakly systemic and give modest yield increases from disease suppression and their “stay green” properties. Until tar spot, a sub-lethal dose of fungicide did not lead to rapid and acute crop failure.
- Most growers do not intentionally leave unsprayed checks, or the check locations do not coincide with disease presence.
- The applied product rate is sufficiently high to cover regions of under-application.
- Taken together, deficiencies are often too subtle for passive detection.
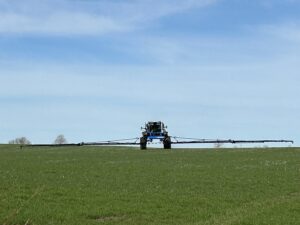
This is not to suggest that pilots intentionally inflate swath widths. Swaths are evaluated during fly-in calibration sessions using established protocols (e.g., Operation S.A.F.E.), and spray drone swath evaluation has emulated these practices. Calibrations take place on bare ground or stubble/grass using two-dimensional samplers (i.e., continuous samplers like string or bond paper or discreet samplers like water-sensitive paper). However, this protocol does not account for any physical interference from the crop canopy itself.
Working with Bayer Canada and Drone Spray Canada, we explored the impact of the canopy on swath width using a spray drone. Working in wheat, corn, and soybean we found swath width was reduced between 20 and 30 per cent depending on the crop and flight parameters.
This may have a far-reaching impact on the number of passes required to uniformly cover a field, which will affect the efficiency and economics of all aerial crop protection methods when coverage is crucial.
The full report can be found at www.sprayers101.ca: RPAS swathing in broad acre crop canopies. •