Market side: Futures trading basics
LESSON 37: TECHNICAL ANALYSIS

CANDLESTICK CHARTING
STAR PATTERNS
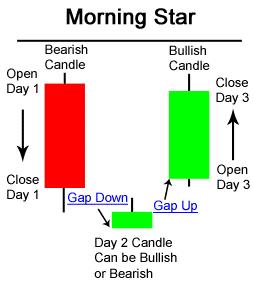
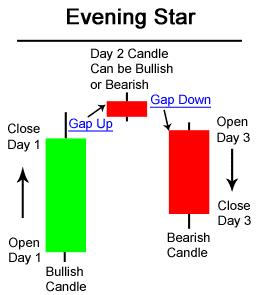
Star patterns are trend reversal patterns that consist of three candlesticks. The middle of these candles forms the star. The star is similar in appearance to a doji or a spinning top except that it appears away from the first and third candle by a gap and is said to be in the star position. For this reason it is on its own as a star would be in the sky. To further confuse the matter, there are three different stars. The morning star appears in a downtrend. Both the evening star and the shooting star appear in an up-trend. Both the morning and evening star have a doji or spinning top as the second candle in the group.
MORNING STAR
Let’s look first at the morning star. This formation consists of a long black candle indicating weak prices. The second candle follows the black candle with a gap down to a doji or spinning top. This is called a star formation due to the fact that it is isolated from the previous bearish candle. From the star, the next candle would be a gap back up to another long, but this time white, candle. This usually indicates a reversal from a bearish tone to a bottom, or a reversal to a bullish trend.
EVENING STAR
The evening star pattern is almost a mirror image of the morning star pattern. The evening star is a bearish three candle pattern which appears at the top of a trending move. The typical formation would see a strong green or white candle which may or may not make a new high but close near the top of the range for the period. The next session would produce the “star” or a gap away with a doji isolating the star from the three candle formation. Finally, the next session would see the candle gap back down and close near the low of the real body for the session and complete the battle of the bulls and bears with the bears in control.
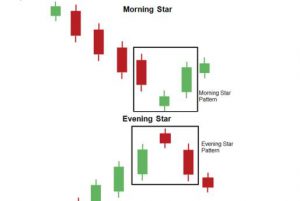
A note about the third candle: in the event the third candle gaps away from the star, the signal becomes much more of a reliable indicator for its success. The distance by which the third candle penetrates the body of the first candle also is significant as to the reliability of this formation. •
| Lesson Definitions: Short candlestick: This type of candle shows possible consolidation on the price action. Long candlestick: Candles with long bodies and short shadows suggest the market is unidirectional. |
Marty Hibbs is a 25 year veteran futures trader, analyst, and portfolio manager. Hibbs was a regular guest analyst on BNN for four years. He is currently a grain merchandiser with Grain Farmers of Ontario.
DISCLAIMER: This information has been compiled from sources believed to be reliable, but no representation or warranty, express or implied, is made by the author, by Grain Farmers of Ontario, or by any other person as to its accuracy, completeness or correctness and Grain Farmers of Ontario accepts no liability whatsoever for any loss arising from any use of same.


