Market side: Futures trading basics
LESSON 20: TECHNICAL ANALYSIS

This monthly educational series features the basic workings of the futures and options markets and how they can be utilized to help farmers with risk management.

BASIC CHART PATTERNS
This month we will discuss the most common patterns that are essential to every chartist. When a trader looks at a historical price chart of any given stock or commodity, they see more than random movements. The trader sees patterns which can help a trader understand the price action, as well as make predictions about where the price is likely to go.
There are two general categories of price patterns. The first is the continuation pattern, which indicates that a price trend is likely to continue. The second category is a reversal pattern. This is not as common and usually marks the end of a trend and the beginning of a reversal in prices, whether they appear near a possible top or bottom of the price range. This simply means that a continuation pattern will appear without interruption to the actual trend, while a reversal pattern can signify an actual reversal in the trend of the underlying asset.
These patterns will be explained in no particular order but will be identified by their category.
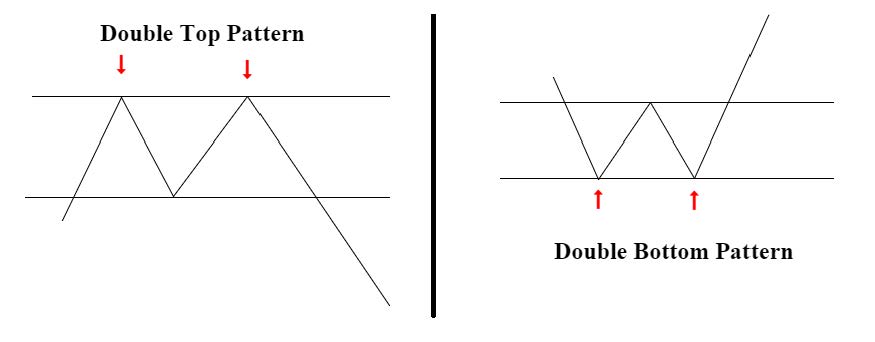
DOUBLE TOPS AND BOTTOMS?(reversal)
This is probably the most common pattern and is identified by the “W” or “M” shape associated with several attempts to challenge the recent top or bottom. The concept is that a price will revisit or test an area of support or resistance more than once. If the test should fail, the price reverses. In the case of the double top, the price drops significantly; or in the case of the double bottom, the price finds support at the test and works higher leaving a “W” shape near the bottom of the price chart. Once prices find either support or resistance, they move in the opposite direction causing a reversal effect on prices going forward. These reversal formations can show up on any timeframe from minute to weekly or even monthly charts.
TRIPLE TOPS AND BOTTOMS (REVERSAL)
The triple tops and bottoms are just another confirmed test of the double tops and bottoms. A chart that shows a triple support or resistance is even more likely to have a significant move in the opposite direction. For this reason, both double and triple bottoms may be referred to as a bullish reversal pattern while double or triple tops are referred to as a bearish reversal pattern.
Lesson Definitions:
Continuation Pattern: As the name implies, a continuation pattern means that the pattern in question suggests a continued move in the same direction of the current trend usually after a pause in the movement. Each pattern has its own rules for measuring such an extension of the anticipated price movement.
Reversal Pattern: A change in the direction of a price trend. Reversal patterns on a price chart undergo a recognizable change in the price structure. An uptrend, which is a series of higher highs and higher lows, reverses into a downtrend by changing to a series of lower highs and lower lows. Likewise, a downtrend will produce the exact opposite effect.
Next month we will explain more common chart patterns using the bar chart. •
Marty Hibbs is a 25 year veteran futures trader, analyst, and portfolio manager. Hibbs was a regular guest analyst on BNN for four years. He is currently a grain merchandiser with Grain Farmers of Ontario.
DISCLAIMER: This information has been compiled from sources believed to be reliable, but no representation or warranty, express or implied, is made by the author, by Grain Farmers of Ontario, or by any other person as to its accuracy, completeness or correctness and Grain Farmers of Ontario accepts no liability whatsoever for any loss arising from any use of same.


