Understanding precision agriculture
A PERFECT PRESCRIPTION FOR EVERY ACRE
DOES THAT ONE “perfect” seed and nutrient prescription exist for every acre on a grower’s field? And could it be just a matter of dialing in that formula and letting the equipment do the legwork?
Not exactly, says the Precision Agriculture Advancement for Ontario (PAAO) applied research team. The reality is that building good prescription maps takes time, careful work, planning, and some training.
Plus, growers need to know whether these prescriptions are helping them make the most of their seed and nutrient inputs on the highest-producing areas of their field, while minimizing their environmental impact.
Collecting and using different data layers — such as yield, elevation, and soil chemistry — are useful in creating management zones that identify areas of a field with the highest and lowest yield potential.
Prescription mapping takes things a step further, as growers can use their data layers as a basis for tailoring seed population and nutrient inputs to help optimize yield potential and productivity for each management zone.
“Of course, the big question on every grower’s mind when you talk to them about prescription maps is, ‘does this work and is it worth it?’,” says Ben Rosser, a corn specialist with the Ontario Ministry of Agriculture, Food and Rural Affairs (OMAFRA).
To find out the answer, Rosser and the rest of the PAAO applied research team — which includes OMAFRA land resource specialist Nicole Rabe — are working with farmer cooperators and consultants across Ontario in fields with different soil types, climates, and geographies.
Each of these fields have management zones that have been developed based on three or more years of yield data that researchers from Niagara College programmed into the Crop Portal — a process that was talked about in the December 2016 ‘Understanding precision agriculture’ article, “Do Something with Your Data”.
VARIABLES
The PAAO applied researchers are focusing on variable rate seed population trials in corn and soybeans, as well as variable rate nitrogen on corn.
The team began by taking soil samples from each farmer’s field to make sure there weren’t any major soil chemistry issues, such as nutrient deficiencies — that could impact the field’s response to the prescription treatments.
“Right off the bat, you want to make sure that you’re getting any basic agronomic issues sorted out,” Rabe explains. “Without having a good, consistent soil condition, it’s hard to tell whether a prescription is having an impact.”
In their seed population prescription trials, the researchers would have the farmer set out a high, normal, and low seeding rate across the field’s different management zones.
“Your seeding rates will depend on your comfort level and what you know about your geography and soil,” explains Rabe. “Depending on what your equipment allows, aim to put down a large enough strip or block so that you can capture separate, clean yield data for the different nitrogen or seeding rates with your combine.”
Rabe cautions that growers need a big enough step between the low, medium and high seeding rates in order to see a change in the yield response for each management zone. For example, one field in their study had corn seed populations applied at increments of 3,000 – 4,000 plants per acre between management zones.
RESULTS
The researchers have been finding corn plants at higher seeding rates tend to have a strong yield response over time, while forming lush, dense crop in high-yielding management zones.
However, for soybeans, the results can take an opposite turn; high seeding rates in highly-productive zones for corn can actually have a negative impact on soybean yield.
“If you have a lush, high-yielding management zone, you’ll find over time that corn tends to do very well, but it can be a riskier environment for soybeans because of disease,” explains Rosser. “Areas where there’s lush growth and high organic matter can be a hotbed for white mould in wetter years, which can reduce yield.”
With that in mind, the applied research team put higher soybean seeding rates in the lower-productivity management zones, while putting the lowest seeding rate in the higher-yielding zones. For corn, they matched the high seed population rates with the high-yielding management zones and the low population rates with low-yielding zones.
In their nitrogen rate prescription trials, Rabe says the applied research team would have the farmer lay down a small strip of the close-to-zero nitrogen rate (less than 30 lbs./ac.) in an area of the field that touched all three management zones, followed by an average rate for the field based on the grower’s usual practice, and then an enriched high rate of about 180-200 lbs./ac. (Figure 1)
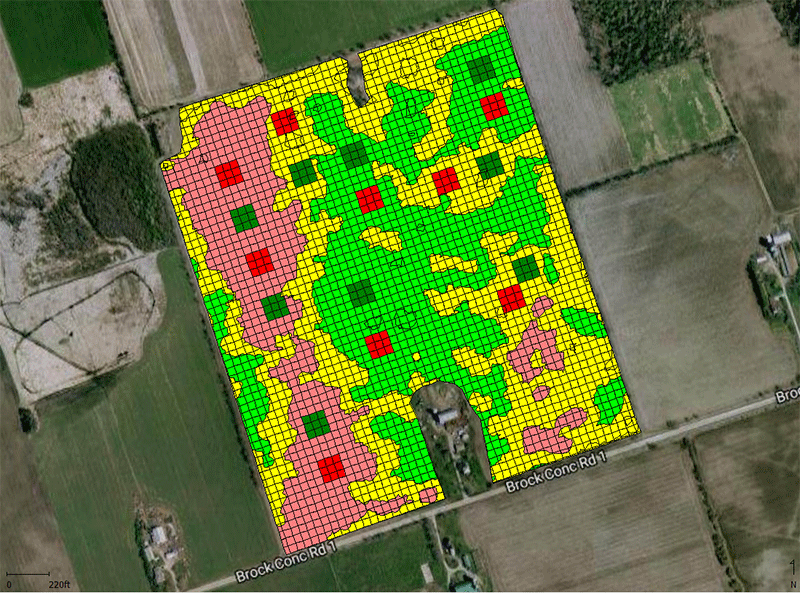
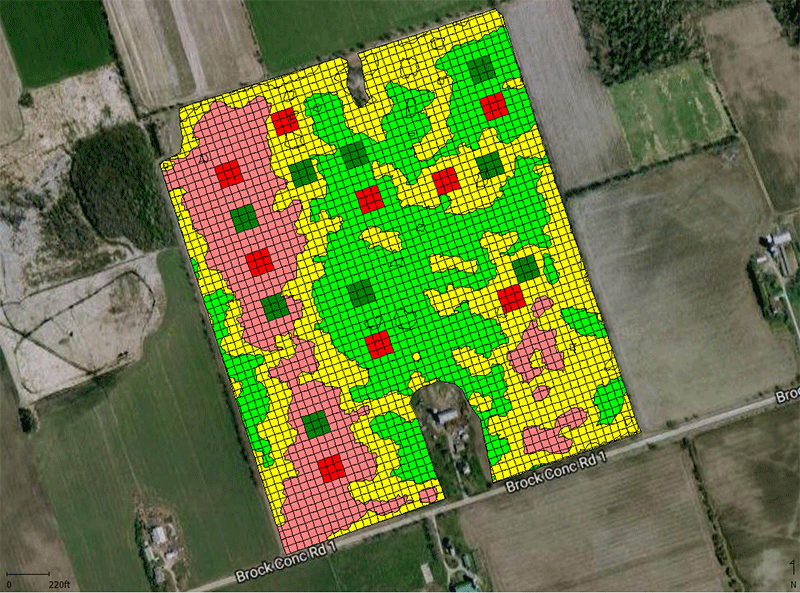
FIGURE 1: TWIN ERIN 2. DURHAM COUNTY: 2016.
Learning stamps for variable rate population on corn. Main zones start using grower normal practice in the medium yielding zone (yellow = 30,000 seeds per acre). Learning stamps test one much lower than normal practice (red = 20,000 seeds/ac) and one much higher than normal practice (dark green = 40,000 seeds/ac). The much lower and higher population checks cover a total of six acres.
At the end of the season, the various strips would be harvested and compared to see what the response to nitrogen was in the field’s high-, medium- and low-producing management zones. What the researchers have been finding is that a field’s response to nitrogen can be tightly connected to an area’s soil characteristics and geographical features.
“In areas where the soil might not have much natural nitrogen supplying potential but good yield potential, you’ll generally see a yield response to higher nitrogen rates,” explains Rosser. “But in other low-lying areas where the topsoil is thick and there’s a lot of organic matter — and more natural nitrogen is being produced — you might not see much of a yield response to a higher nitrogen rate.”
He adds that laying down the close-to-zero rate in small, pre-programmed areas that don’t take up a lot of space and won’t impact the overall bottom line can help growers see the difference in each management zone’s natural soil nitrogen supply. If that grower were to apply a high, enriched nitrogen rate beside it, they could see what the yield potential of that area would be if nitrogen was not a limiting factor.
Growers can also revisit their data layers — such as elevation, yield or soil chemistry — to see whether the yield response to their nitrogen rates matched up with the original data for their field.
As a way of finding out whether the different seed or nitrogen prescriptions are having a positive effect on yield, the PAAO team has also been building in a series of small check strips or blocks — called “learning stamps” — within each of the field’s management zones the highest- and lowest-seeding or nitrogen rates. (Figure 2)
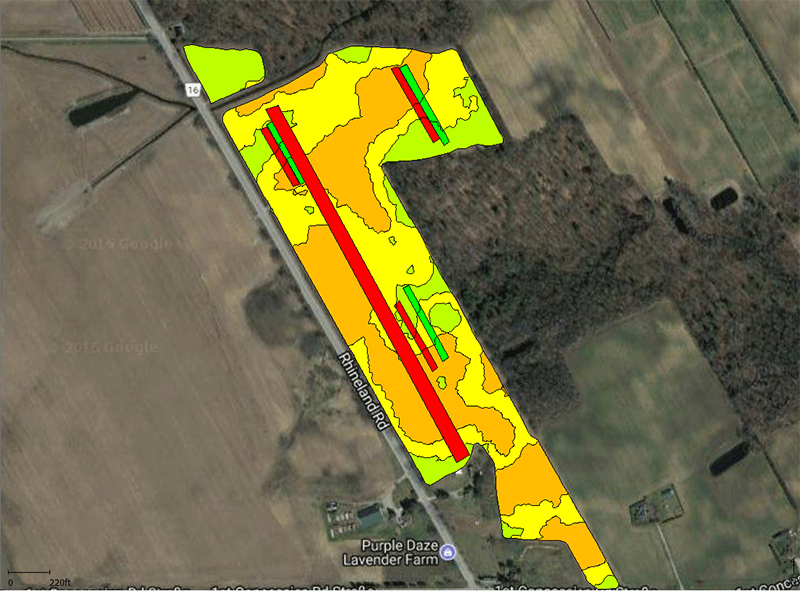
FIGURE 2: RHINELAND 1. NORFOLK COUNTY: 2016
2016 mini strips – Base zones start with medium nitrogen rate (grower’s normal practice) and go up and down from there. Mini strips test extra low and high rate with very few acres at stake in the less than 30lbs zero nitrogen strip. The farmer chose to leave a full length zero nitrogen strip to test an optical sensor for nitrogen application at chest-high corn.
The use of check strips and blocks was first discussed in the December 2015 ‘Understanding precision agriculture’ article, “Prescription Maps and Validation” and will be covered in more detail during this article series.
GET YOUR FEET WET WITH VARIABLE RATES
With a little pre-planning and effort, growers can experiment with manually applying different rates on smaller portions of their fields — especially if they’re not planning to make a big investment in variable equipment straight away.
“Start to get your feet wet on a few acres, or by using your home farm so that you’re giving yourself the space to experiment and see what needs to be done,” says Rosser. “You may also look into hiring a consultant who has the software and experience to help you.”
Growers can manually lay down a series of test strips of different seed or nitrogen rates that could be done as separate passes through an area of the field and manually marked using the tractor’s GPS, or by counting passes from the field edge. The key, explains Rosser, is to properly match up the yield monitor data with the test strips at the end of the season to see if there were different responses to the seeding or nitrogen rates in various parts of the field that could be managed, such as zones with high and low yields and differing topography.
This project was funded in part through Growing Forward 2 (GF2), a federal-provincial-territorial initiative. The Agricultural Adaptation Council assists in the delivery of GF2 in Ontario. •


