Market side: Futures trading basics
LESSON 33: TECHNICAL ANALYSIS

CANDLESTICK CHARTING
This lesson we will continue with basic candles.

Once we complete our overview of the basic candles, we will group them in patterns. They will be identified as single candle patterns, two candle patterns, and three candle patterns. In each of these groups, we will further identify bullish and bearish candles and their meaning.
DOJI
One of the most popular candles, the doji is shaped like a cross. This means it has a shadow but no real body (or very little). The picture of a doji tells us by simply looking at it that the struggle between the bulls and bears (or supply and demand) is an equal struggle, and there is no winner once the candle has completed.
Because a doji is considered a non-decisive candle, it should be viewed as a possible reversal point, especially when it appears in either an overbought or oversold position on a chart. The next candle in the sequence should be carefully watched to see if the reversal continues. The doji pictured represents a textbook doji with no body. There are some doji candles that will display a very small body, and while they are classified as doji candles, they do have a story to tell. We will look at these later in this lesson. In all, there are actually five different doji candles.
LONG LEGGED DOJI
Taking the doji candle a step further, we realize that there is more of a story to the doji than just a case of the opening and closing being the same. Doji candles come with both long and short shadows, which can signal the power struggle that was evident while the candle was being formed. The doji with a long shadow appearing at the top of a move indicates that the bulls tried unsuccessfully to drive prices higher into new high territory but failed to sustain the move. This is a signal that the resistance was met with much selling, and a possible top is imminent. Likewise, if the long shadow doji appears at the bottom of a move, it tells me that the bears tried to push prices well into new low territory but the result was strong buying coming in to offset the sellers. Again, this would be a potential sign that a reversal is looming. Either way, the doji is doing its job by warning the analyst that caution should be taken, and that a reversal is very possible in the next few sessions.
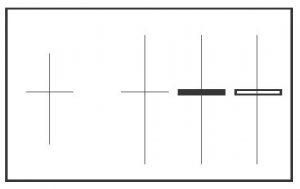
Notice the long legged doji candles pictured; in each case, there was a minor difference in the close of each. The first image is a textbook doji with the same opening and closing price. The black or solid candle beside it is also a long legged doji, but the solid colour suggests that it closed lower than it opened (although by a very small margin). The third image is also a long legged doji, but in this case the closing was ever so slightly higher than the opening. Although they can all be classified as textbook doji candles, the candles on the right show that the close and open were not identical. This may also have some impact on the outcome of the next series of candles.
In our next lesson, we will discuss the other three doji candles and their meaning and importance. •
| Lesson Definitions: Candlestick lines: a traditional Japanese chart which consists of a real body, representing the open and close, and upper and lower shadows, representing the high and low of the day. Doji: forms when a candle’s open and close are virtually equal. The length of the upper and lower shadows can vary, and the resulting candlestick looks like either a cross, inverted cross, or plus sign. Doji convey a sense of indecision or tug-of-war between buyers and sellers. Prices move above and below the opening level during the session, but close at or near the opening level. |
Marty Hibbs is a 25 year veteran futures trader, analyst, and portfolio manager. Hibbs was a regular guest analyst on BNN for four years. He is currently a grain merchandiser with Grain Farmers of Ontario.
DISCLAIMER: This information has been compiled from sources believed to be reliable, but no representation or warranty, express or implied, is made by the author, by Grain Farmers of Ontario, or by any other person as to its accuracy, completeness or correctness and Grain Farmers of Ontario accepts no liability whatsoever for any loss arising from any use of same.