Understanding precision agriculture
REMOTE SENSING
THIS ARTICLE IS the sixth in a series intended to introduce and explain the concept of management zones; how to define, delineate, and characterize them, and to outline the kinds of data and computer tools needed to be successful (go to www.gfo.ca/research/precisionag to read previous articles you may have missed).

Remote sensing data layers can aid in creating reliable, accurate, and stable management zones. Remote sensing includes imagery from a variety of sources (e.g. satellite, unmanned aerial, or remotely piloted vehicle, airplane etc.) or from in-field on the ground sensors that perform real time mapping of the plant or soil (e.g. electrical conductivity, organic matter and pH sensors, vegetation indices from tractor mounted optical sensors). Remote sensing images or maps can be used to validate the stability of the management zones (e.g. at different times of the year you can see the same zone defined by the soil and the growing crop as you find on the yield maps). Remote sensing images are also very valuable for defining the management zones in the first place, if you do not have other data layers like yield maps.
In previous articles, we discussed three other components of management zones: yield, landscape (topographic), and soils. This article will briefly discuss the process of acquiring ground-based remotely sensed map data and/or imagery from a variety of sources and processing it for the development of management zones.
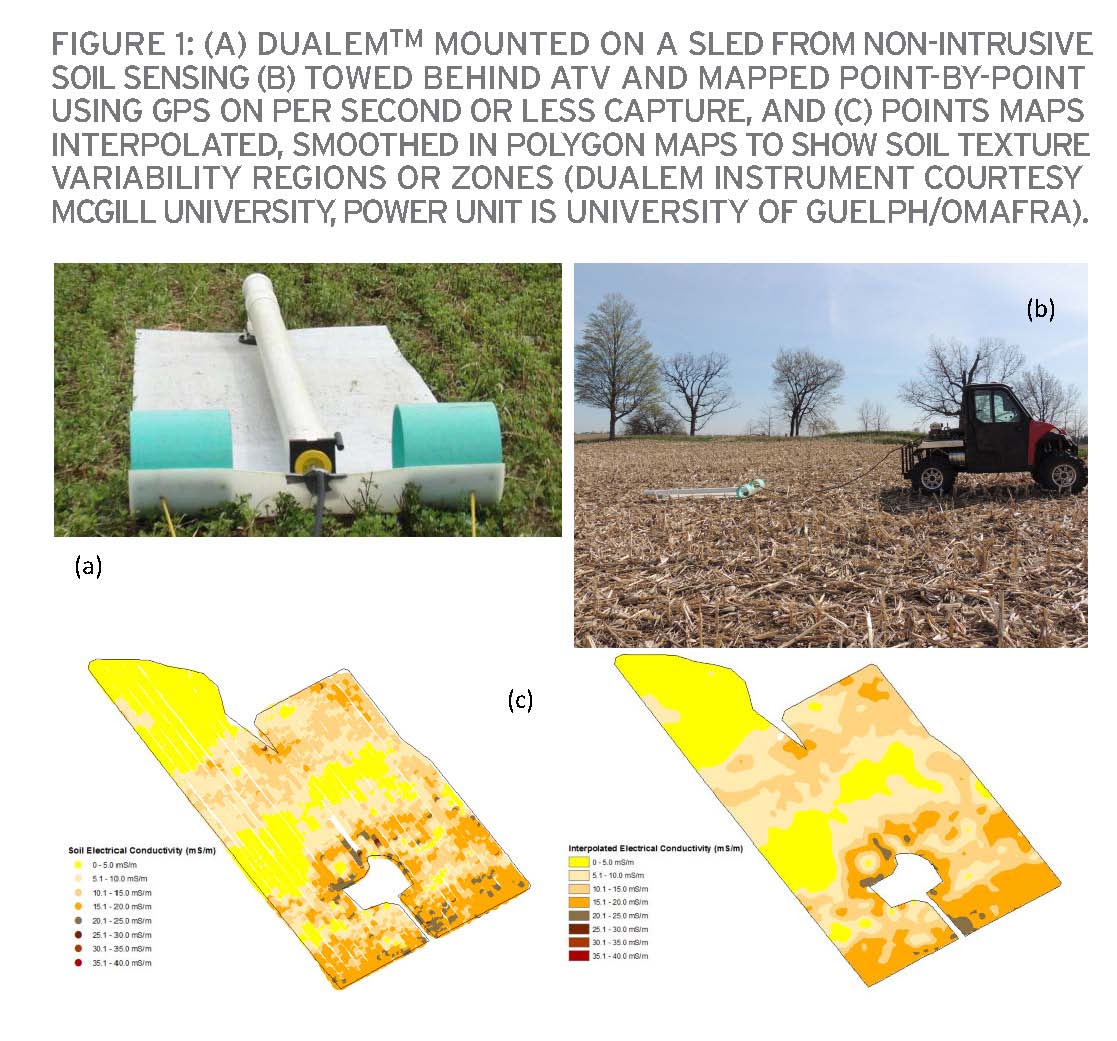
Ground based soil sensors such as the DualEMTM (Figure 1a) measure the conductivity of the soil (mentioned in the last article) and are mapped as points captured on a per second or less basis using a GPS (Figure 1b). The maps are then interpolated to create a continuous surface (Figure 1c). This system is very similar to a GPS enabled combine monitor and mapping system. In most cases, elevation data is also collected at the same time to characterize the agricultural landscape using RTK-GPS.
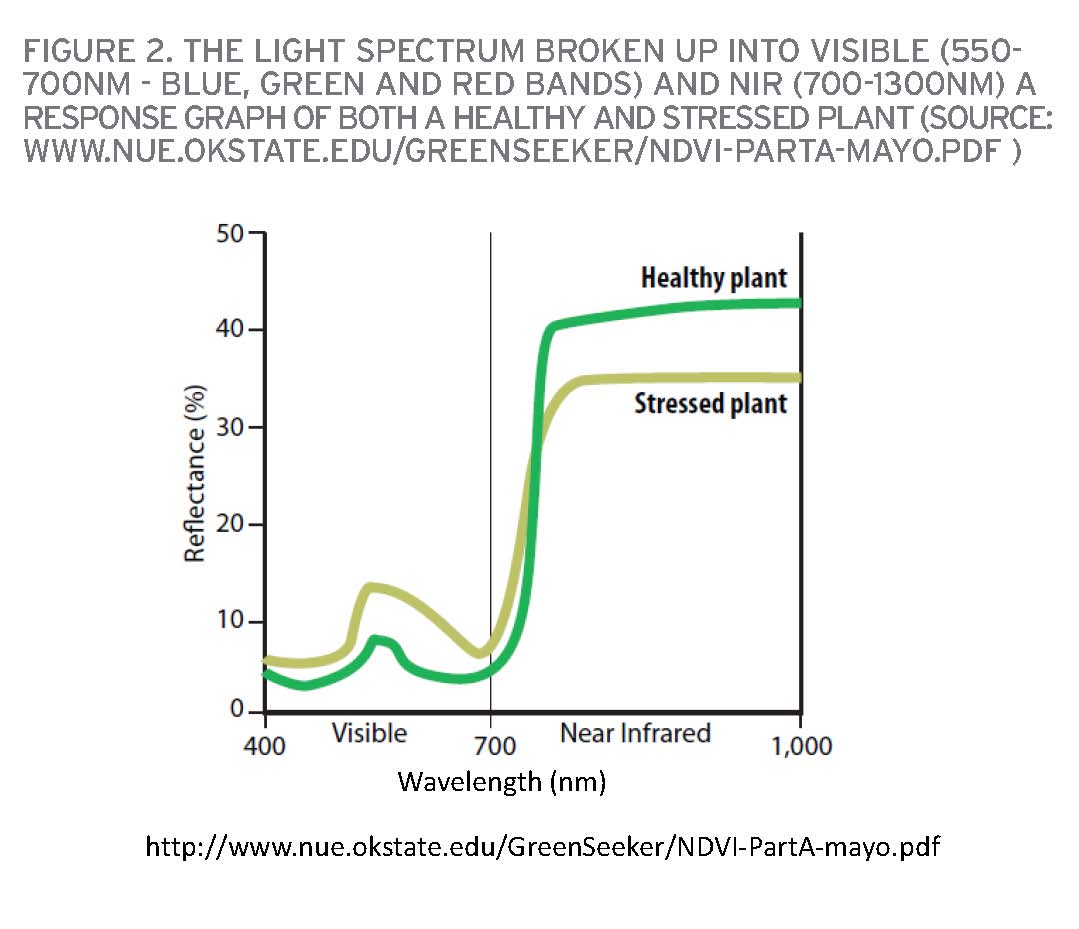
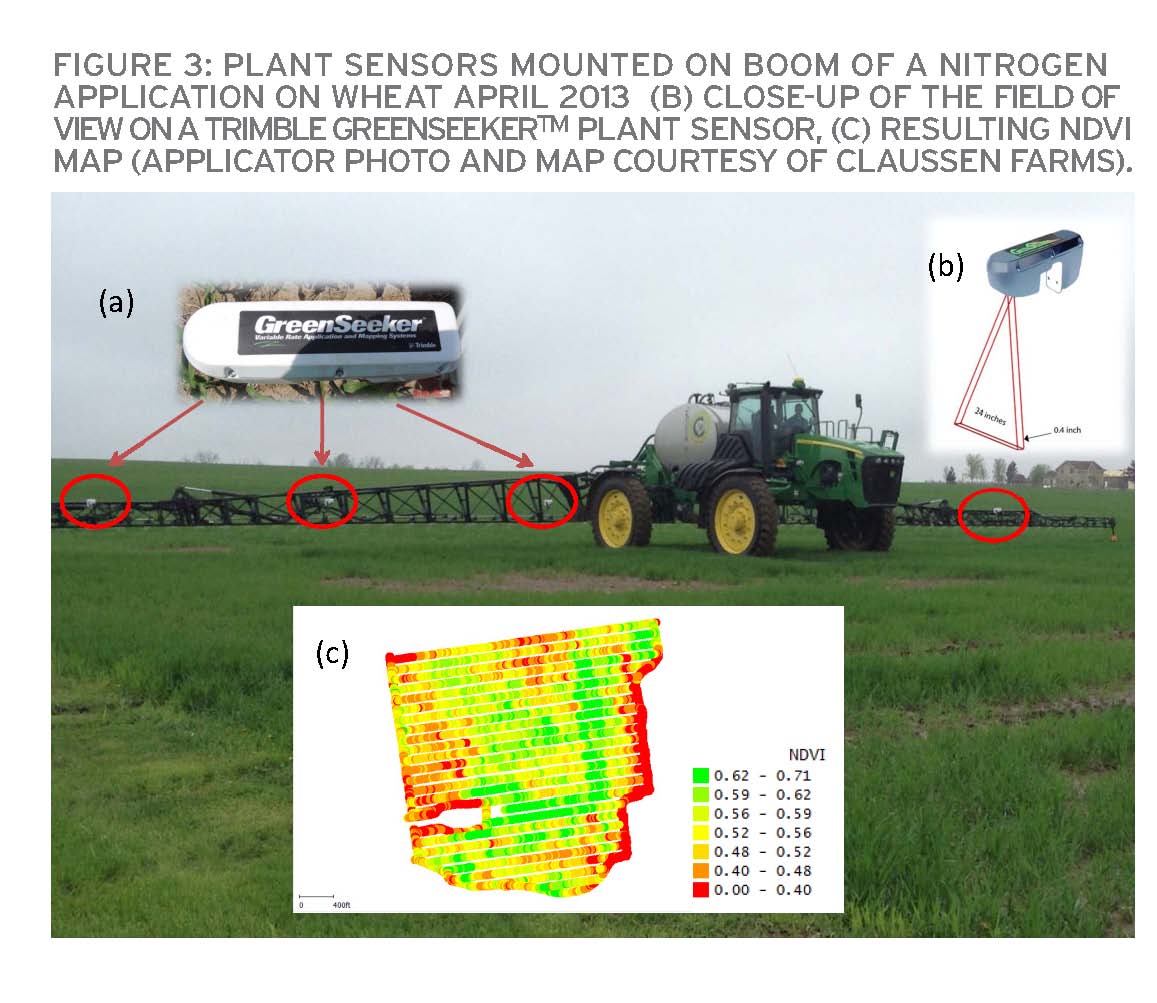
Ground based plant sensors, such as the GreenseekerTM (Figure 3a), are optical instruments which measure plant status. The red and near infrared bands of the light spectrum create a vegetation index known as a Normalized Difference Vegetation Index (NDVI). The red band is part of the visible portion of the spectrum (550-700nm) and measures light absorption by chlorophyll in the crop (Figure 2). The near infrared (NIR) band is further along in the light spectrum (700-1300nm) and can penetrate the leaf surface to measure leaf tissue properties. If the plant is very healthy and strong (not stressed at all) it will strongly reflect the NIR.
Many agricultural ground-based sensors like the Greenseeker or AgLeader OptRx are mostly used to guide the application rate of nitrogen based on ‘plant status’ in real time. These sensors are not nitrogen specific, they measure how much chlorophyll the crop is producing (red is a chlorophyll absorption band) differentially across the field. The plant sensor has a field of view or lens just like a typical digital camera (Figure 3b), each sensor captures data which is then averaged across the implement width and interpreted by an algorithm/equation resulting in a nitrogen (N) recommendation (for more information on different regional N management equations visit: www.nue.okstate. edu/). The maps are also captured on a point-by-point basis (Figure 3c) and can then be interpolated to create a continuous surface similar to yield maps and soil sensor maps. These maps are useful as they sense crop performance during the growing season but can also reflect soil differences (i.e. texture, moisture, properties that affect crop growth). The NDVI maps from a real-time sensor in the field can be used outside of N application as a source for developing or checking that the management zones are reliable year in and year out through varying growing conditions.
Remotely sensed imagery comes in a variety of free and ‘for purchase’ solutions. Satellites which orbit the earth are limited to a specific revisit schedule (such as every 8 – 16 days) depending on how many satellites are following one another on the same orbit at the same altitude. Some earth observation satellites offer free imagery collected continuously (e.g. Landsat observation satellites http://earthexplorer.usgs.gov/). Earth observation satellites typically are low to medium spatial resolution (20 – 30m2 per pixel or raster cell) whereas purchased satellite imagery can be quite high resolution (5m down to a sub-metre). Some commercial satellites can be pre-programmed to collect data over a specific location or region, frequency, and time frame. There are many farm based GIS programs which have purchasing options for satellite imagery online over a specific farm field (Winfield solutions, SatShot, etc.).
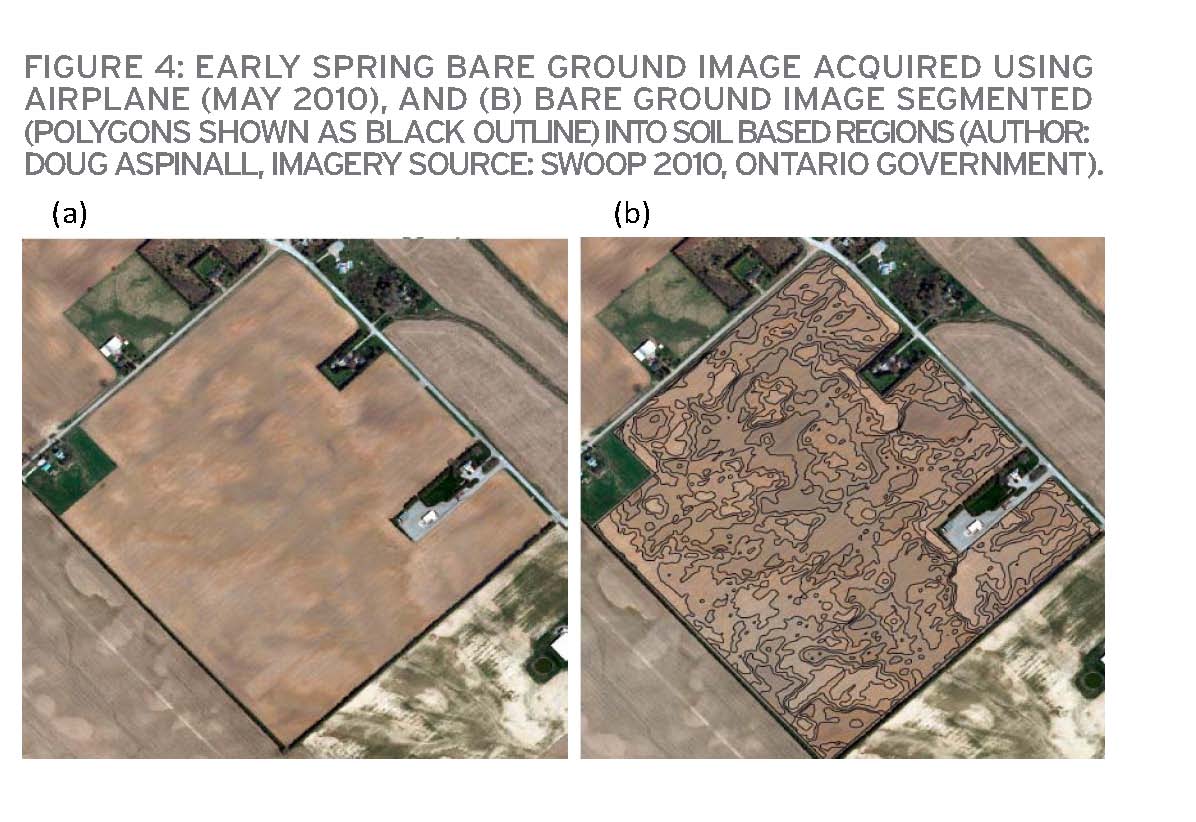
The value of any remotely sensed imagery for the creation of management zones depends on how the imagery is processed to create a value-added product. Keep in mind these are not pretty pictures, optical sensors numerically measure how light is reflected or absorbed by the soil or the crop. Early spring bare ground imagery (or close to bare ground) is useful for identifying soil zones (Figure 4a). Dark brown areas in this visible natural colour image are typically areas of the field that are lower depressional areas with higher organic matter and hold more moisture. Light brown to white areas are typically tops of knolls, lower in organic matter, and have lower moisture holding capacity. These images can be processed automatically into zones (Figure 4b).
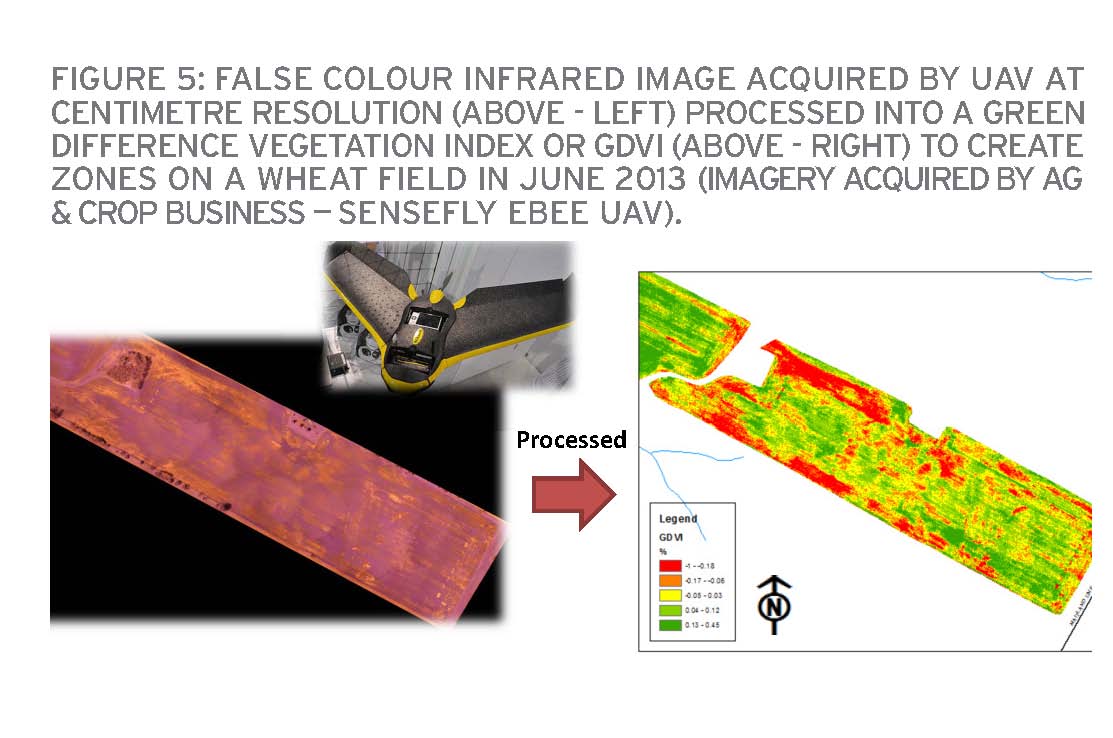
Timely in-season images of an aging crop can be classified into soil related zones which typically reflect soil textural and moisture holding capacity variability in a number of landscape positions across the field (Figure 5). Most often any in-season imagery will utilize the red and NIR bands just like the ground-based sensors mentioned above.
Typically, the in-season raw images are post-processed into a vegetation index. A vegetation index is just an algebraic equation that is calculated between the bands that measure the visible and/or NIR light.
The most commonly referenced index in agriculture currently is the Normalized Difference Vegetation Index (NDVI). These calculations are based on adding or subtracting the spectral bands from one another (e.g. NDVI = NIR – red / NIR+ red bands). Other bands, depending on the sensor, can be substituted into the equations. Instead of the red band, the green band can be substituted which measures how green the crop is (Figure 5 shows Green Difference Vegetation Index acquired by UAV). There are many vegetation indices that correct for soil noise in the imagery, and many other imagery analysis tools are becoming available online as a web service that clean up the imagery and focus only on the crop not the soil, crop, shadow, or weeds (e.g. Trimble PurePixel).
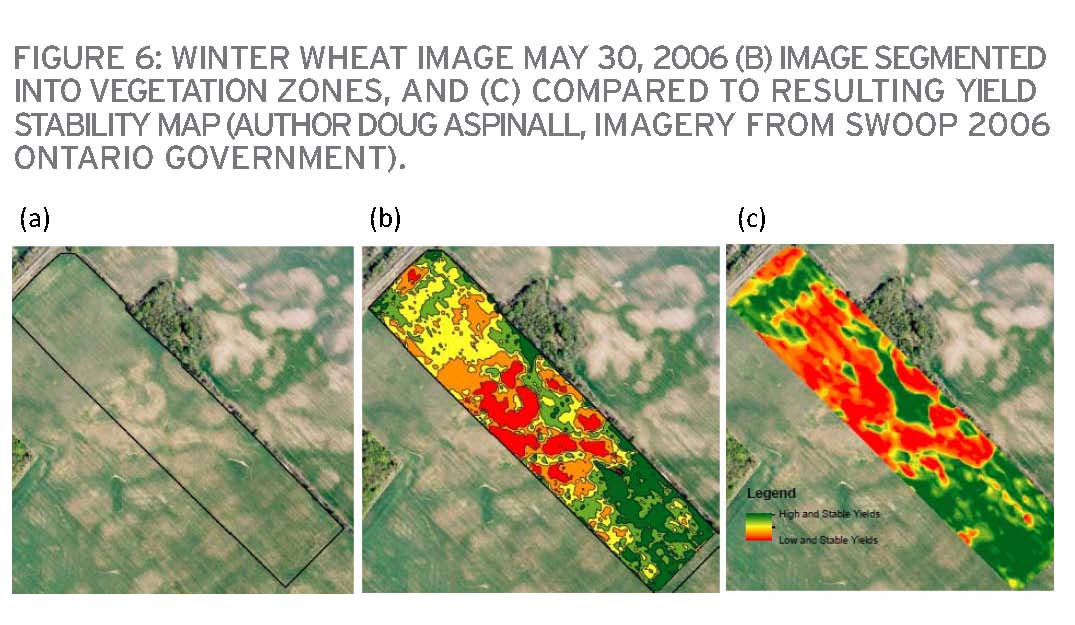
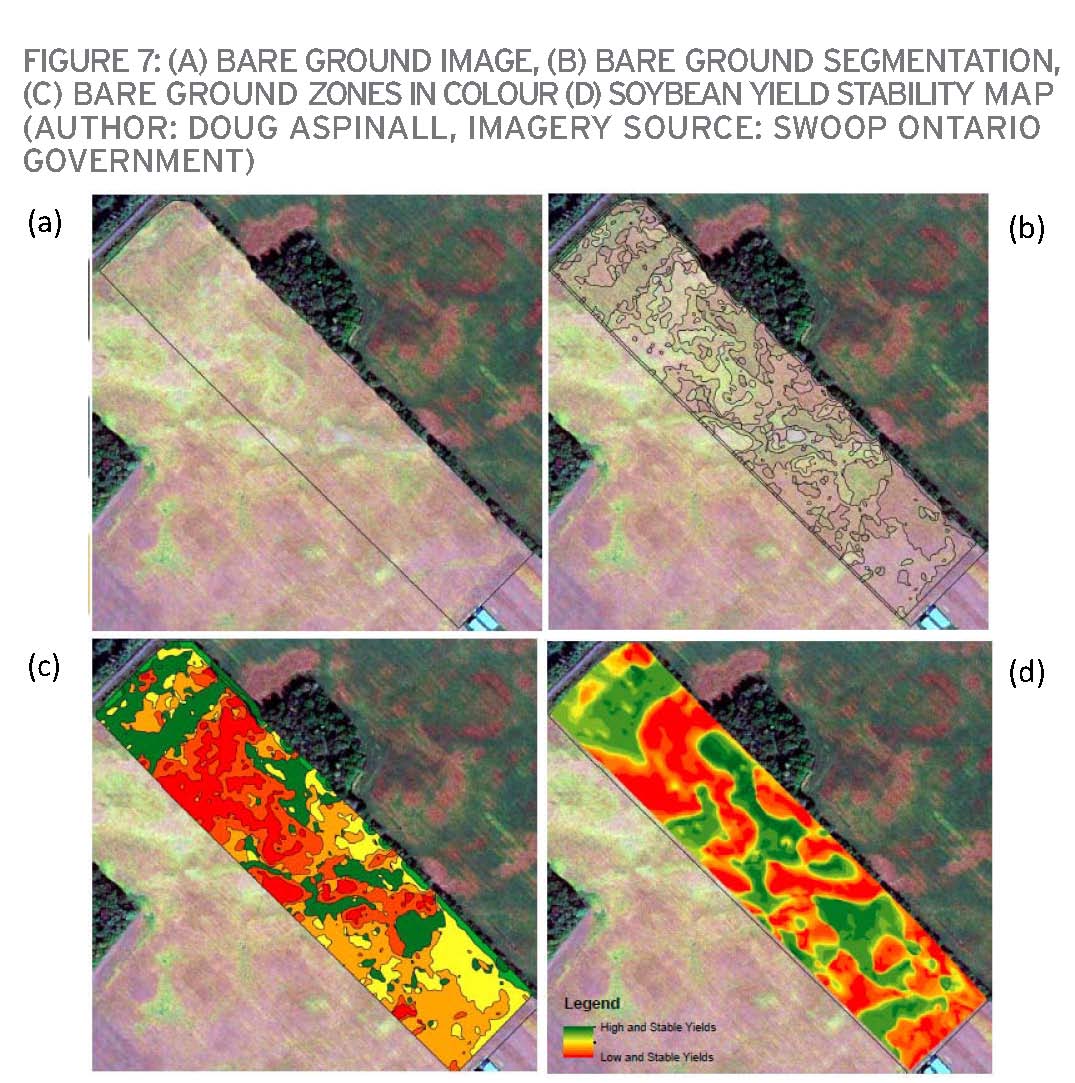
Any map created from imagery should be ground-truthed or verified by walking the field and the zones derived from the image. Other data layers collected on the same field (yield maps, soil maps) can also be used to verify that the zones shown from a bare ground image or an in-season image are present across the field. Figure 6 illustrates the process where imagery taken by an aircraft on a wheat field in the early spring is transformed from the raw natural colour image, into zones, and compared to historical yield data. Figure 7 illustrates a similar process but showing the bare ground segmentation analysis compared to a soybean yield stability map.
SUMMARY
Remote sensing can happen on the ground (via tractor mounted sensor) or by air (via satellite, aircraft, UAV). The imagery and data collected by these sensors measure how the crop absorbs or reflects light at one snapshot in time. The crop status depicted in these images and/or maps changes depending on the time of year, crop growth stage, and status as well as the weather in a specific growing season. There are a wide range of remote sensing tools that can be used to help define management zones, or validate management zones created using other data layers such as yield, landscape, and soil. The tools selected should depend on the purpose (creation of a management zone versus validation of existing zones) and the price point which is reasonable for your farm operation.
The remote sensing commercial options continue to evolve at a rapid pace. Satellites are being launched at an ever increasing pace which will bring down the cost of imagery, provide better revisit time (images over a field every three to four days) and more cloud free imagery with higher spatial resolution. The processes to gather and use the data can be laborious and complex but their use will get simpler as the technology develops. There are several companies consulting on remote sensing and provide opportunity to incorporate the use of these tools into defining your management zones for the first time, or simply strengthening the definition of the management zones with other data layers you may already own.
Remote sensing has two significant aspects, only one of which was addressed here, that being as a tool to create or enrich management zone development. The other aspect of remote sensing is used in-season for the s patial and temporal management of a crop (such as more efficient crop scouting) leading to optimization of input levels variably across a field landscape. •


