Market side: Futures trading basics
LESSON 31: TECHNICAL ANALYSIS

CANDLESTICK CHARTING
Most traders and technicians today use bar charts for analysing their trading options. However, candlestick charting is rapidly becoming more popular and is a superior form of analysis.

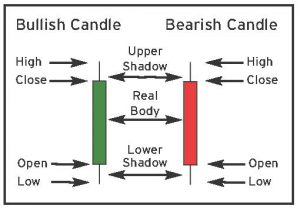
Candles, as they are commonly known, are a style of bar chart utilizing a colour coded visual representation of prices where trades occurred during a specific time frame. The bars have the appearance of candlesticks and capture the same data as the traditional open, high, low, and close (OHLC) bars, but the colour coding allows for easier interpretation. We see several variations of candle colours which include green or white for bullish and black or red for bearish.
 Each bar can represent any specified period of time, with the typical bar durations being used for five, 15, 30, and 60 minutes for shorter term analysis, and daily, weekly, and monthly for longer term analysis.
Candlestick patterns and chart patterns made up of many candlesticks can be helpful to technical analysts that study price action in order to forecast price into the future.
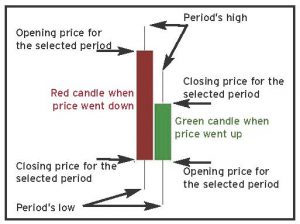
The wide part of the candlestick is called the “real body” and tells investors whether the closing price was higher or lower than the opening price. If the real body is solid (black/red), the underlying instrument closed lower than it opened, a clear (white/ green) candle tells us that the underlying instrument closed higher than the opening. The candlestick’s shadow/wick shows the time period’s high and low and how they compare to the open and close.
Western style charting or OHLC bar charting can be combined with candlestick charting to embellish the technical possibilities of true analysis. This is because the wick of the candle represents the same values as the bars on a bar chart, the only visual difference is the “real body” or the fat part of the bar which represents the difference between the open and close prices of that time frame.
To review, a candle is made up of four important components.
- High price: this is represented by the top of the wick. If the futures price opens at the high for that period the “real body” will identify the high as there will be no wick showing.
- Low Price: this is represented by the lowest part of the wick or if the futures price opens at the low of the time period, there will be no wick and the lower edge of the “real body” will be the low.
- Opening price: this is represented by either the highest or lowest part of the real body which may or may not be equal to the high or low of the period.
- Closing Price: this is represented by the highest or lowest part of the real body and may or may not be equal to the high or low of the period.
Remember, if the real body is green or white (clear), the opening is the lowest part of the “real body” because the clear body indicates a bullish move meaning it closed higher than the opening. Likewise, if the real body is red/black (solid), it means that the opening was the highest part of the real body. •
|
Lesson Definitions: Doji: A candle with the wick representing equal opening and closing prices and no real body Wick: Sometimes called a “shadow”, this is the part of the candle that measures the extreme high and low for the candle period. It is usually indicated by a thin line above and below the real body. |
Marty Hibbs is a 25 year veteran futures trader, analyst, and portfolio manager. Hibbs was a regular guest analyst on BNN for four years. He is currently a grain merchandiser with Grain Farmers of Ontario.
DISCLAIMER: This information has been compiled from sources believed to be reliable, but no representation or warranty, express or implied, is made by the author, by Grain Farmers of Ontario, or by any other person as to its accuracy, completeness or correctness and Grain Farmers of Ontario accepts no liability whatsoever for any loss arising from any use of same.