Field crop finances
A NEW RESEARCH REPORT
professor alfons weersink, along with Kenneth Poon and Glen Manjin from the University of Guelph’s department of of Food, Agricultural and Resource Economics recently completed a research report titled: The Financial Performance of Ontario Agricultural Sectors – Field Crop. The report covers the financial performance of Ontario’s field crop sector. The researchers examined the financial wellbeing of the farm sector by incorporating tax data collected by the Ontario Ministry of Agriculture, Food and Rural Affairs (OMAFRA) and administered for the Canadian Agricultural Income Stabilization program (now AgriStability and AgriInvest). The analysis done with the dataset provided insight into the farm sector that otherwise was not obtainable.
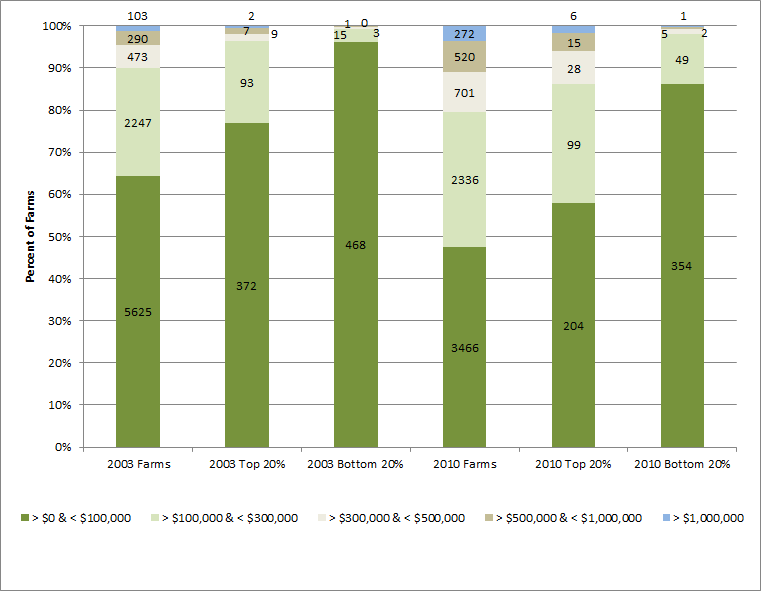
The research confirmed the notion that revenues have increased since 2006 in conjunction with the trends in crop prices. Sales were concentrated in the largest group of farms; and the cost of production increased with revenues, but not at the same rate. In 2003, around two-thirds of the farms sold less than $100,000, comprising about 1.5% of total sales in the province. In contrast, farms selling more than $1 million represented 1% of all farms but sold 55% of all crops. The largest 8% of farms had more than 90% of all field crop sales in 2003. Similar trends were apparent in 2010 but with less concentration.
FIGURE: SHARE OF TOTAL OPERATING REVENUE / PERCENT OF FARMS
understanding the research
The study incorporates an array of financial indicators like Operating Profit Margin (OPM) or returns on sales to benchmark farm profitability. OPM increased from a low of around 5% in 2005 to approximately 20% in the last several years for all sales classes that have revenues greater than $100,000. An OPM of 10% is considered to be the minimum threshold for financial health.
Operating Expense Ratio (OER), a measure of what it costs to operate a piece of property relative to the income it generates, has moved in a positive direction with crop prices as it has fallen from a high in 2006. With the exception of the smallest revenue class, the average OER was consistently below 65%, which is considered financially healthy, indicating field crop operations have adjusted to market conditions even during years of low commodity prices.
Debt Coverage Ratio (DCR), a ratio of cash available for debt servicing to interest, principal and lease payments shows improvement over the last several years. Before the turnaround in crop prices, DCR values averaged 110% implying a difficulty to pay debt. However, profitability improvement wasn’t uniform across all field crop farms. The study draws an interesting observation with regard to the distribution of the various farms in terms of sales, in particular farms characterized with sales of $100,000 or less. It suggests that there are truly two sides to the same coin (as shown in the chart above). Farms characterized with sales of $100,000 or less tend to make up the majority of both the most profitable farms category as well as the least profitable farms category. As noted, in 2003 about two thirds of farms were categorized with $100,000 or less; in 2010, that figure dropped closer to 50%. In the chart above, the first and fourth bar graphs represent the share of farms in each sales class; the other two bar graphs for each year indicate the percentage of farms that were consistently in the top 20% and bottom 20% in terms of operating profit margin. This contradicts the notion that the distribution among farms in the same sales class (i.e. $100,000 or less) is uniform. More importantly, it highlights the importance of all aspects of farm management; and how optimizing each role is necessary for a successful and profitable business. •


