Resistance points
HOW TO USE THEM AS PRICING TARGETS
QUITE OFTEN FARMERS are told to follow a three part process for developing their marketing; work out your cost of production, understand the seasonal patterns of the commodity futures that set the prices you receive, and prepare a selling plan ahead of time. In addition to this, farmers are often told to work out their own financial risks and objectives.

One of the challenges facing farmers adopting this process is the methodology for selecting attainable target prices for their sales. Obviously, rational sellers will want the ‘highest’ price possible. The problem is there really is not a dependable way for determining that ‘highest’ price ahead of time.
The use of resistance points can be helpful for setting commodity futures price targets.
RESISTANCE POINTS
What are resistance points? There is a whole branch of trading philosophy called technical analysis.
In simple terms, technical analysis attempts to use recurring chart patterns as indicators of upcoming price behaviour. Resistance points are one of the graphical methods that technical traders use in picking price targets.
Futures contract prices are commonly depicted using bars. Each bar usually represents a day, a week, or a month. On a daily chart, the highest point in the bar shows the highest price for the day, while the lowest point on the bar shows the lowest price point for the day. The notch on the left side usually represents the opening price for the day while the notch on the right side of the bar shows the closing price for the trading period.
When technicians look at commodity futures bar charts we sometimes find a pattern that shows prices rising, eventually faltering, and then changing direction and falling. When technicians find such a pattern, they draw a line at that point and say they have found a resistance point (a point where the market has failed to go higher).
The more times prices rise to a resistance point and retreat, the more significant technicians say the resistance point is. Resistance points represent price levels where enough buyers are refusing to pay more while enough sellers are turning up to sell. The net result: prices retreat.
USING RESISTANCE POINTS
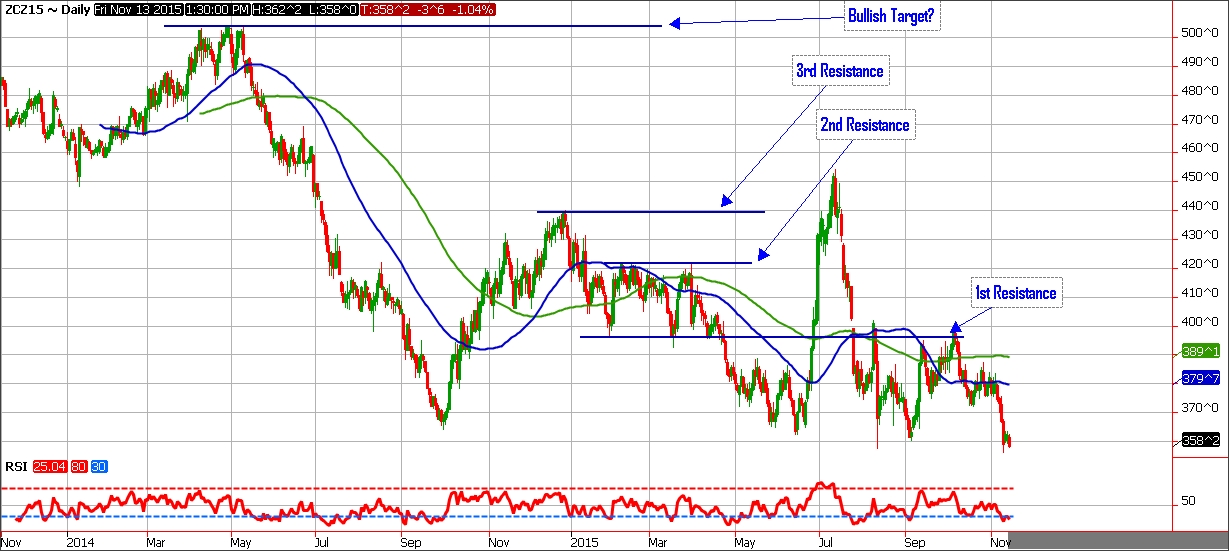
Looking at the December 2015 corn futures contract chart we see a resistance point at $4.40/bu (labelled 3rd Resistance) formed sometime in November 2014. This price, (together with the resistance around $4.30/bu — labelled 2nd Resistance) is a price target suggested by resistance. In fact, this target (and the $4.30/bu before it) was hit in July 2014. A seller who used the $4.40/bu resistance point as a price target would therefore have achieved their futures price goal for corn.
Some farmers may decide that the $4.40/bu is too low. Indeed, if we had a severe weather event in 2014 it is very likely that the highs for the year would have exceeded our $4.40/bu price target.
I want to suggest that using resistance points to seek out achievable upside price targets is just one more tool. This tool builds in actual recent price action.
The corn futures chart in fact suggests another resistance point around the $5.05/bu level which I have labelled “Bullish Target”. In an event driven market, this would be a price target — as one of my professors used to say, “at the end of the day all technical analysis is based on fundamentals”. By that, we mean supply and demand factors.
If your resistance point target is hit, you continue to have choices around how to ‘take’ a price. If you want to be able to benefit should prices keep rising, you can use a put option to hedge. This will have a cost but does leave open the upside. Once you have a plan almost anything is possible.
The identification and use of resistance points to set price targets is just one more technique in our search for the elusive market high. I do not suggest this technique constitutes a magic bullet, but, given the large number of traders who make decisions using technical factors, it is probably worth our time to include this technique in our marketing toolkit.
You can use the following websites to find out more about resistance points and technical analysis methods:
• http://stockcharts.com/school/doku.php?id=chart_school:chart_analysis:support_and_resistance
• https://en.wikipedia.org/wiki/Technical_analysis
• http://stockcharts.com/school/doku.php?id=chart_school
Victor Aideyan is president/CEO of HISGRAIIN Commodities Inc. He utilizes his 20 years of experience in commodity marketing to help agricultural commodity producers better understand elements of the business planning process such as profit drivers and risk management. •


