Market side: Futures trading basics
LESSON 18: TECHNICAL ANALYSIS, CHARTING

This monthly educational series will feature the basic workings of the futures and options markets and how they can be utilized to help farmers with risk management.
AS A TECHNICIAN, there are several choices when dealing with historical data charts. In this article, we will attempt to identify the most common choices and their most popular patterns and studies.
Charts are generally used to study the price movement of an underlying asset. In the case of a commodity chart, the images or bars are a picture of the price action for a given time-frame for that particular commodity. These lines form patterns that are identifiable to a technician and may assist them in deciding when to buy, sell, or hold a position, as well as predict the strength of the actual movement. Many patterns are easy to recognize such as double tops, or double bottoms, which we will describe in detail later. As you become more comfortable with the chart patterns, you will see that different commodities work more effectively with different patterns.
There are two basic types of chart patterns: continuation patters and reversal patterns. Continuation patterns are patterns that will continue in the direction of the main trend after a brief consolidation or correction. These include ascending and symmetrical triangles. The continuation pattern is the most common as trends generally continue in a given direction for several months to several years before reversing. Reversal patterns, on the other hand, usually signal an end to a trend as the trend stops and reverses direction as prices begin to trade in the opposite direction after the completion of the pattern. An example of a reversal pattern could be a double top or a double bottom. We will discuss patterns in the coming months.

The analyzing of trading patterns is essential for anyone who trades the markets even if the sole purpose is only to identify entry and exit points as well as possible stop losses. Next lesson we will describe the main types of charts used in analysis. •
Marty Hibbs is a 25 year veteran futures trader, analyst, and portfolio manager. Hibbs was a regular guest analyst on BNN for four years. He is currently a grain merchandiser with Grain Farmers of Ontario.
|
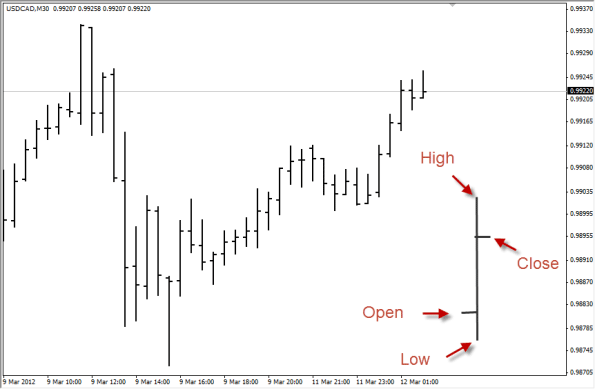
Lesson Definitions: Historical chart: An historical chart records and graphs price movements that may be used at a later date to identify patterns for the purpose of identifying trends and future price movements. These charts can store data for any given time frame. The most popular are daily, weekly, and even monthly charts dating back twenty years or more. Above is a typical bar chart used in futures analysis. |
DISCLAIMER: This information has been compiled from sources believed to be reliable, but no representation or warranty, express or implied, is made by the author, by Grain Farmers of Ontario, or by any other person as to its accuracy, completeness or correctness and Grain Farmers of Ontario accepts no liability whatsoever for any loss arising from any use of same.


