Crop responses to management
Are accurate predictions possible?
With Doria Ali & Lauren Deshaw
There is much interest in varying crop management strategies across farm fields – the essence of precision agriculture. The main driver of this has been advances in variable rate technology which have made the practice possible. Many questions are being asked with no clear measure of variability (both spatial and temporal) in the responses. Is variable management economic? How accurate are the prescriptions that inform the variable rate controllers? Most who have invested in the system are cautiously optimistic and willing to validate, learn, and recalibrate. What is the best approach to validate and calibrate? The answers to these questions must be derived from scientific protocol. In other words, hypotheses are stated, objectives formed, then an appropriate scientific protocol needs to be designed to address the hypotheses and objectives.
The main objectives of this research were to: test corn and winter wheat response to various management strategies spatially across the field; associate these responses with various soil parameters; and analyze these responses with some novel spatial statistical analysis.
The vast majority of experiments and trials continue to be designed on small plots, or averaged across field length strips, ignoring differences that occur spatially within each experimental unit or plot. For example, it can be argued that the top “variables” for high economic returns in corn are hybrid choice, optimal plant population, N rates, or whether a fungicide was applied at the VT growth stage (assuming all other agronomic decisions follow a best management practice). In winter wheat, those major variables would include genetics and management of N and disease.
In Ontario, recent University of Guelph and Ontario Ministry of Agriculture, Food and Rural Affairs (OMAFRA) corn and wheat data averaged from small-plot and field-length strips have changed our recommendations. However, little is known on the responsiveness of these various management strategies (or combinations thereof) across variable landscapes. We know that these responses vary across the field, but little is known on the magnitude of these responses and how they vary with time (e.g., year) and space (e.g., location in the field). If these numbers are known, then they can be plugged into economic models to determine their economic feasibility.
For example, the application of expensive inputs only on responsive areas of farm fields would pose significant economic gains in those areas; in other non-responsive areas, input investment may be reduced (e.g., lower rates of nutrients, no fungicide, etc.) which may lower environmental impact and improve profit margins Only a few studies have been conducted in Ontario on science‐driven, site‐specific experiments in wheat and corn; it is clear that intensive background measurements are needed to understand crop responses across variable landscapes.
STUDY DETAILS
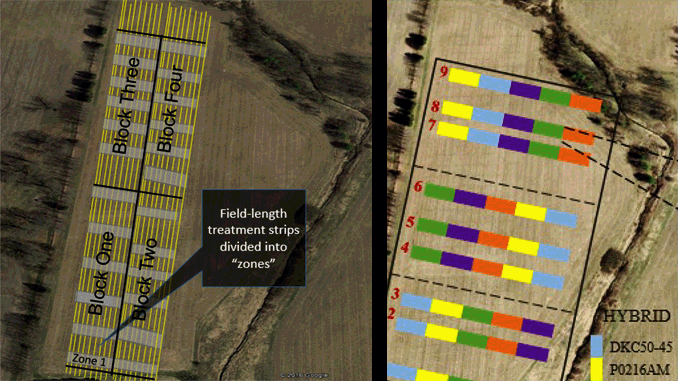
In this study, 14 field-scale experiments were installed in southwestern Ontario, with the objective to identify site-specific opportunities for intensive management in corn and both soft and hard red wheat, and to characterize the response of various intensive management strategies across zones of field variability. Fields were selected with characteristics of spatial variability (e.g., varying topography, soil types). The corn fields were planted into replicated “learning blocks” or “stamps” of five full-season, high-yielding corn hybrids, with each hybrid grown with combinations of different N fertilizer rates, seeding rates, and with/without fungicide at silking (Figures 1 and 2).
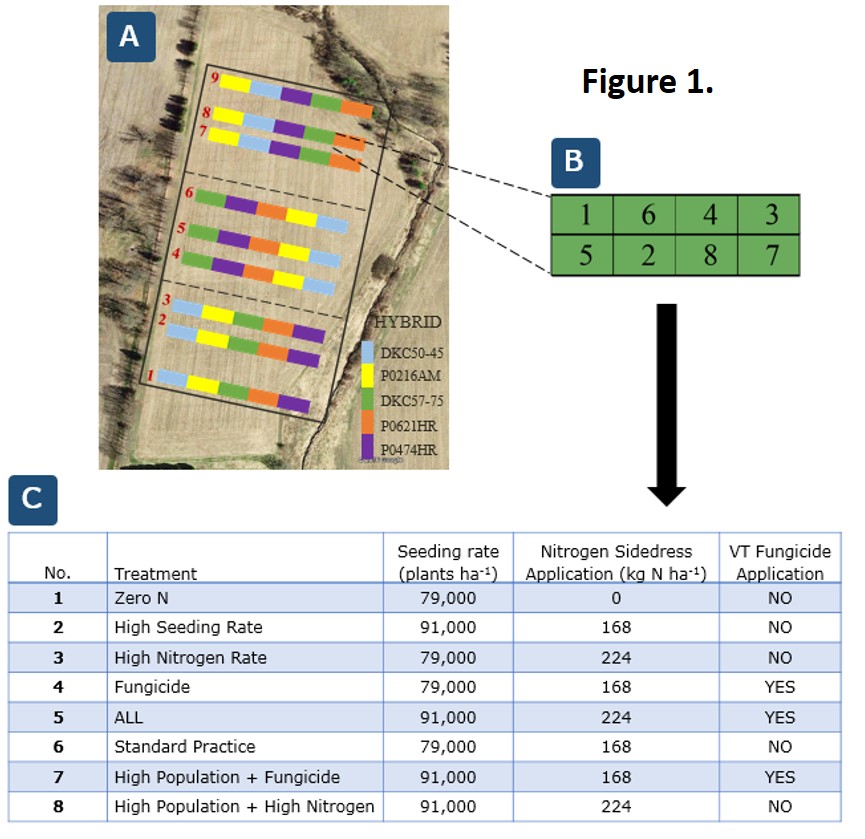
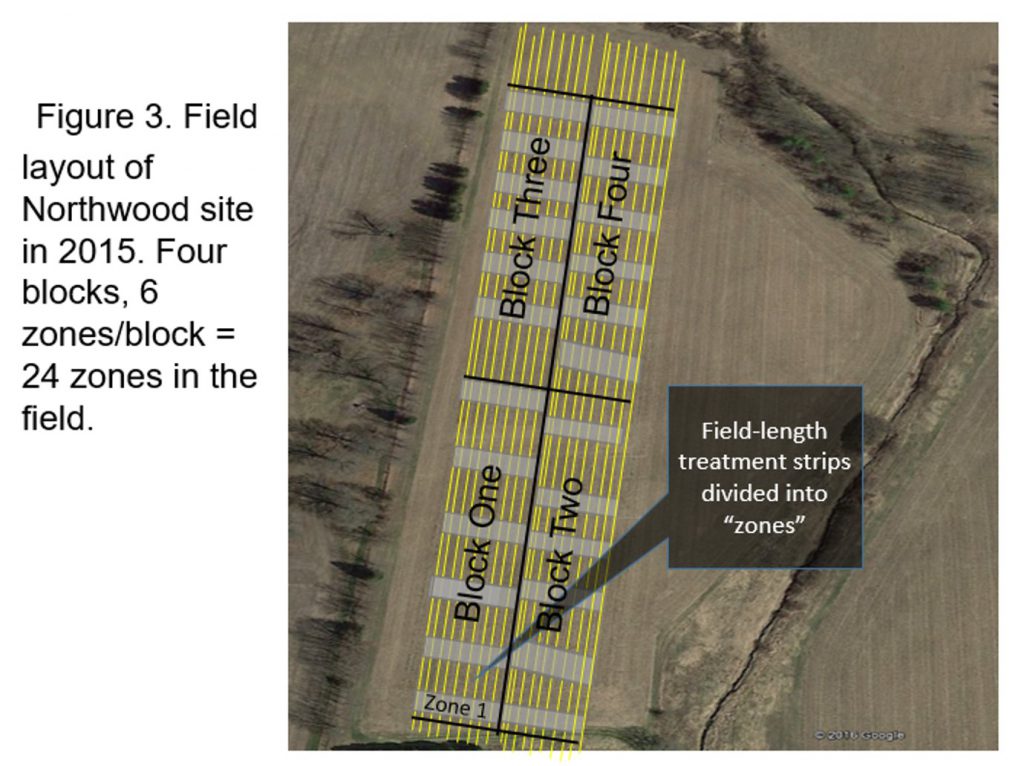
In the wheat, the treatment list and field layout depended on the wheat class (Figures 3 and 4). The main focus on hard red wheat was N management strategies (source, timing, and rate) for yield and protein management. In soft red, both N (timing, rate) and fungicide (with and without T1 and T3 timing) were investigated using “learning blocks” or “stamps” applied across each field site. The project objectives tested the hypothesis that the feasibility of agronomic inputs depends on the spatial location within a field. Attempts were also made to associate the spatial response of these agronomic treatments to soil characteristics across each field.
| # | Soft Red Treatments | Hard Red Treatments |
| 1 | 90 lbs N/ac mid-April timing, no fungicide | 90 lbs N/ac mid-April UAN |
| 2 | 90 lbs N/ac mid-April timing, Prosaro @ flowering | 90 lbs N/ac as 45/45 split Urea/ESN mid-April |
| 3 | 90 lbs N/ac split (greenup/GS32), no fung. | 150 lbs N/ac mid-April |
| 4 | 90 lbs N/ac split (greenup/GS32), Prosaro @ flowering | 150 lbs N/ac as 75/75 split Urea/ESN mid-April |
| 5 | 150 lbs N/ac mid-April timing, no fung. | 90 lbs N/ac mid-April + 30 lbs N/ac urea solution @GS70 |
| 6 | 150 lbs N/ac mid-April timing, Prosaro @ flowering | 90 lbs N/ac as 45/45 split Urea/ESN mid-April + 30 lbs N/ac urea solution @GS70 |
| 7 | 150 lbs N/ac split-timing (greenup/GS32), no fung. | 150 lbs N/ac + 30 lbs N/ac urea solution @GS70 |
| 8 | 150 lbs N/ac split (greenup/GS32), Prosaro @ flowering | 150 lbs N/ac as 75/75 split Urea/ESN mid-april + 30 lbs N/ac urea solution @GS70 |
| 9 | Zero N check (only adjacent to sampling zones) | Zero N check (only adjacent to sampling zones) |
CORN
The corn portion of the project aimed to characterize crop responses to hybrid, plant population, nitrogen fertilizer, and fungicides depending on the spatial position within a farm field location. Corn response to an increase of plant population from 32,000 to 37,000 plants/acre averaged approximately five bushels/acre (P<0.05) across all site-years, which might be a conclusion in conventional field trials with a population treatment; however, this project adds the dimension of site-specific responses.
The actual responses to the higher plant population were both site-specific and hybrid-specific, which varied between minus 25 to plus 30 bushels/acre depending on hybrid and location in the field.
In general, the better yielding areas of the fields tended to respond more to the higher plant population, especially at the highest N fertilizer rates. Field areas were also identified that did not respond to the higher plant population. Responsive areas were only very weakly associated with medium-textured soils with higher organic matter levels compared to other soil types and low organic matter.
Corn yield response to an additional 50 pounds of nitrogen per acre over normal practice varied between -15 to 36 bushels/acre depending on the location in the field, and fungicide responses varied from -17 to +17 bushels/acre depending on the location in the field.
The data demonstrate opportunities for reducing crop inputs on areas of fields, while increasing inputs on other areas, if areas or zones in the field could be correctly identified and predicted in-time for the management decision. However, after a preliminary analysis of the data, the main conclusion from this study was that the variability in responses to inputs was only weakly correlated (if at all) to soil characteristics or topography. The data also show that some hybrids were more responsive in some areas of fields than others.
This project provides an excellent foundation for studying multi-hybrid research, or equipping planters with the ability to plant multiple hybrids across the field depending on field position; however, these areas or zones will need to be identified before planting. More work needs to be done with intensive hybrid management (genotype x environment x management interaction). It is interesting that hybrid response to intensive inputs was related to the genetics of the hybrid for disease tolerance and the ability for plants to stay green long into the season.
WHEAT
In wheat, we also investigated whether or not site-specific crop responses can be predicted from extensive soil characterization and topographical features. Similar to corn, the wheat data showed yield and quality responses to management depended highly on spatial location in the field. A reduction of N rates from normal practices in some areas equates to improved resource efficiencies and a lower environmental impact, while other zones responded to higher rates of N.
There was much more “noise” in the data than anticipated: the magnitude of the grain yield and protein response was either very weakly associated, or not at all associated, with any topographical feature or soil parameter. The spatial variability in yield and protein shows that production and economics have the potential to improve through better resource allocation (the basis for precision agriculture), but if the responsive and non-responsive areas in the field cannot be identified in the advance of application, then the feasibility of variable application of inputs may be much lower than expected. We did not test whether responsive zones are responsive in future years. Work in the U.S. from the University of Wisconsin by Dr. Joe Laur has shown that temporal variability in responses is greater than spatial variability due to weather (in other words, a responsive zone in one year can be non-responsive the next). If that is true, then predictions for variable rate prescriptions would not be accurate.
CONCLUSIONS
It was found that the magnitude of winter wheat grain yield/protein and corn yield responses to varying genetic, nitrogen, and fungicide management strategies were indeed dependent on the spatial position in most of the project fields. This spatial variation is the main driver for the marketing, adoption, and use of precision agriculture technologies, whereby crop inputs are optimized depending on the spatial position in a field, rather than a traditional approach of applying the same inputs uniformly across a field.
However, the key finding was that, in most of the project fields, there was only a weak association, if at all, between crop responses and soil parameters/topography such as soil nutrients, pH, soil organic matter, soil CEC, and elevation. We found this by comparing soil characteristics and topography in only areas with extreme crop responses (i.e., characteristics amongst the highest response to inputs vs. no crop response to inputs). This means that the crop response to the major inputs (examined in this study) could only be “weakly predicted” using the measured soil and topographical data. Although grain yield and quality responses varied across farm fields, this project has produced strong evidence to show: the feasibility of predicting crop response to inputs may be weak at best; crop response to variable inputs needs to be validated in the field rather than relying on “faith” to drive the adoption of precision agriculture – most users of the technology do not validate the performance of precision agriculture technology and prescription maps; and the potential for precision agriculture may still exist, as the crop responses were highly variable spatially. Other tools need to be investigated or developed that could more reliably predict crop responses to inputs.
This project was funded in part through Growing Forward 2 (GF2), a federal-provincial-territorial initiative. The Agricultural Adaptation Council assists in the delivery of GF2 in Ontario.
David C. Hooker is an associate professor in the Department of Plant Agriculture, University of Guelph Ridgetown Campus (dhooker@uoguelph.ca). Doria Ali and Lauren Deshaw are M.Sc. graduate students at the University of Guelph Ridgetown Campus. •