Market side: Futures trading basics
LESSON 38: TECHNICAL ANALYSIS

LONG TERM ANALYSIS ON SOYS
In June we witnessed the beginning of a bottoming formation which changed our outlook on soybeans for the first time in two years. The pattern that was displayed on the monthly soybean chart was a potential bottoming of prices; however, it is critical that a retest of this bottom is supportive, otherwise this bottoming action could last for six months to a year and we could be looking at prices as much as $2 – $3 lower than we currently stand (at the end of June we hit a low of $8.40). That would put us close to the common trading price of $5 from 13 years ago before the 2006 bull market began.
There is potential for this drop in price due to the uncertainty around tariffs on agriculture commodities that could be implemented by U.S. president Donald Trump. My personal feeling is that it won’t get quite that bad — but it depends a lot on Trump’s policies. I’m a believer that once the bottom is reached we will return to a bull market fairly quickly. I feel global weather issues will play a major role in crop production, which will ultimately cause the next bull market over the next two to three years.
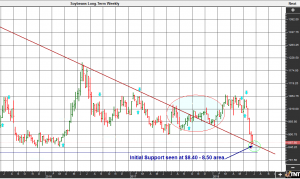
Looking at the daily futures chart, we saw major resistance turning prices south. The freefall of $2 per bushel within the month of June to our major support at the $8.40 level suggested the markets were oversold. Regardless of long term trends, I would expect a healthy bounce before $8.40 is seriously challenged again as our major support level. I am expecting a move back to the $9.50 – $10 level based on the lead month futures contracts one more time before we retest the critical level of $8.50.
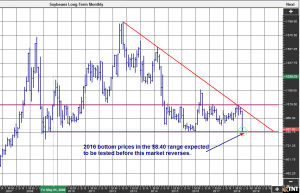
If the rhetoric with Trump persists, farmers should consider locking in some of their crop when we reach the $9.50 – $10 level on the lead month futures. This will protect some profits going forward as I believe there is a better than average chance of prices retesting the $8.50 level before the end of the year.
My concern with the weekly chart is after breaking the downtrend line in October 2017 we are now right back to that trend line. This is a normal situation except for the speed at which prices dropped and my red sell signal at $9.70. If we can’t get back past the June 22 of $9.20 the formation becomes a flag formation which extends about a $1 lower. $7.50 is a more likely scenario on the futures than the doom and gloom $5 scenario.
This analysis is my opinion as a former broker/trader and farmers should make their own marketing decisions based on their own circumstances and business needs. This analysis is based on market conditions as they appeared at press time. •
Marty Hibbs is a 25 year veteran futures trader, analyst, and portfolio manager. Hibbs was a regular guest analyst on BNN for four years. He is currently a grain merchandiser with Grain Farmers of Ontario.
DISCLAIMER: This information has been compiled from sources believed to be reliable, but no representation or warranty, express or implied, is made by the author, by Grain Farmers of Ontario, or by any other person as to its accuracy, completeness or correctness and Grain Farmers of Ontario accepts no liability whatsoever for any loss arising from any use of same.


