Your nitrogen rate report
AGRONOMIC INFORMATION FROM ONTARIO'S CROP SPECIALISTS

Food and Agribusiness Corn Specialist
It’s the end of another season. The idea of “report cards” may not exactly evoke excitement, but think about a nitrogen (N) rate report card as a good one – one that might deliver confidence around nitrogen rate decisions on your farm.
There are lots of good tools used to guide nitrogen rate decisions (nitrogen credits, pre-sidedress-nitrate tests, rainfall, soil types, etc.), but at the end of the day, the only way to truly get a handle on optimum nitrogen rates on your own farm is to collect yields from some different nitrogen rates.
This can be very simple. One of the easiest ways might be the “30-pound” test, that is, three side-by-side applicator-width strips of the following (Figure. 1):
- 30 lb-N/ac lower than normal N rate
- your normal N rate
- 30 lb-N/ac higher than normal N rate
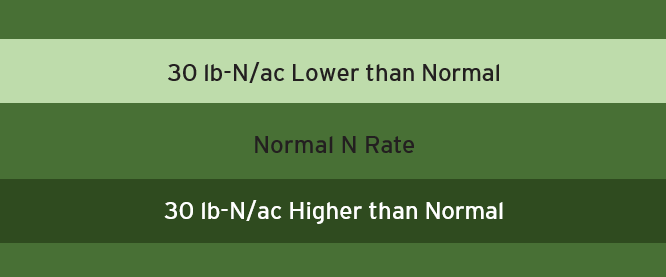
Apply these rates in whatever way works best. Ideally, replicate these plots at least twice. Remember where they are and collect yields from each one at harvest.
As yields have trended up over time, one grower in Elgin County wanted to know if he should be applying more N than his traditional rate of 158 lb-N/ac. In 2023, he applied treatments very similar to the 30-lb test (Table 1). Results showed that his normal nitrogen rate appeared sufficient even in a very high yielding and wet year like 2023. Relative to his normal nitrogen rate:
- Lowering nitrogen rates (-32 lb-N/ac) resulted in yield losses (-15 bu/ac) that were much more costly than the N saved
- Increasing nitrogen rates (+32 lb-N/ac) resulted in little extra yield (+2 bu/ac) and certainly not enough to pay for the extra nitrogen applied
| N Treatment | N Rate (lb-N/ac) | Yield (bu/ac) |
| Lower N Rate | 126 | 212 |
| Normal N Rate | 158 | 227 |
| Higher N Rate | 189 | 229 |
Table 1. “Nitrogen rate report card” from three nitrogen rates tested by grower in Elgin County in 2023.
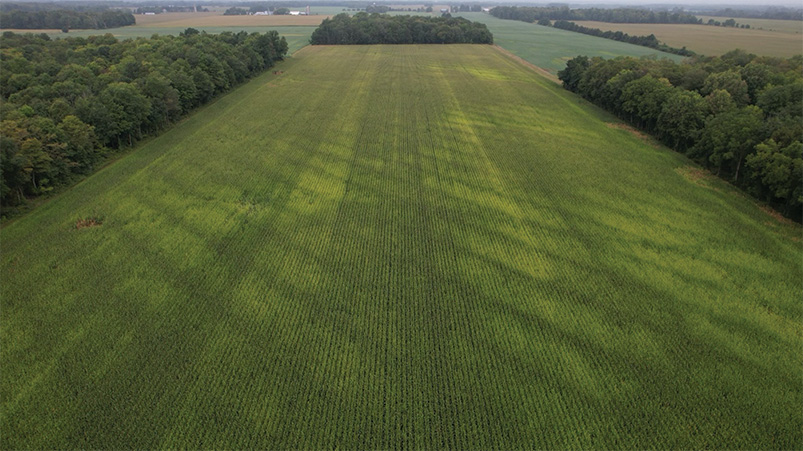
These results gave the grower good confidence that his normal nitrogen rates were enough to meet the needs of the area tested, even in a very high-yielding and high rainfall year (Figure 2). We know optimum nitrogen rates vary year to year, even within a relatively small area of a field. It would be good to repeat these strips over time (and maybe space) to compare nitrogen across various environments. •


