Determining soybean yield
INFLUENCE, FACTORS, AND VARIABLES
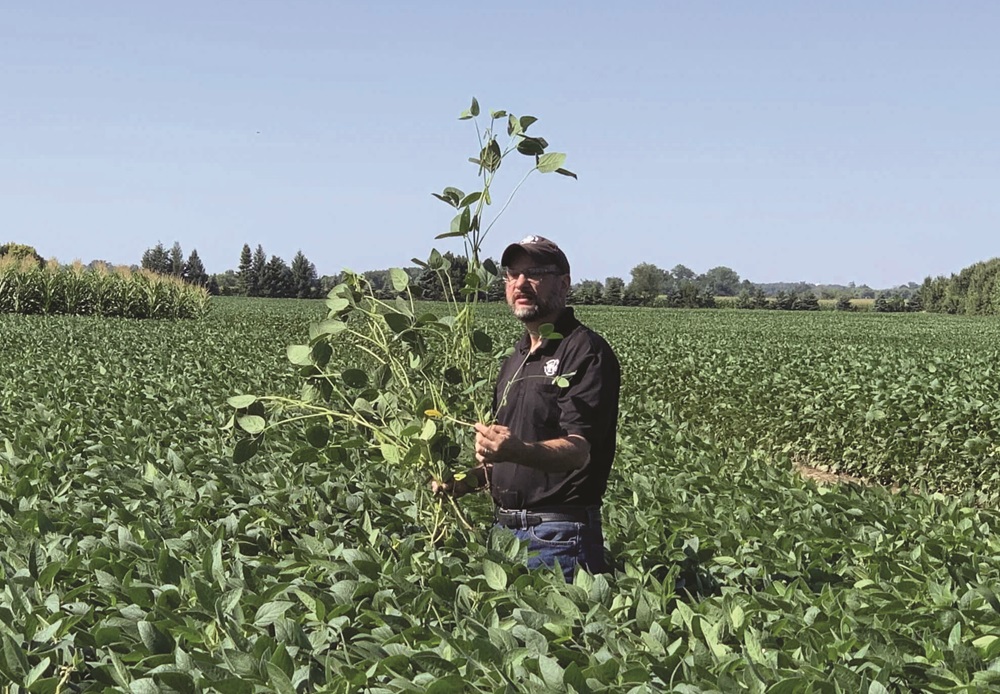
NOTHING IN AGRICULTURAL RESEARCH ever unfolds quickly, nor are desired results guaranteed. Delving into data and distinguishing between viable recommendations and the anomalies that may arise is enough to discourage the most resilient individuals. Every treatment, weather vagary, soil characteristic and parameter is under scrutiny to achieve consistent and reliable results to help growers.
When it comes to increasing soybean yield, there have been advances in plant performance through selective breeding and transgenics, the effects of tillage, and the use of fertilizers and chemical products. The ultimate question before researchers and extension personnel is whether reducing the variability in soybeans is possible.
A more enticing view of this research is the project, “100-Bushel Soybean: What’s Really Holding Us Back?” A joint three-year effort between the University of Guelph, the Ontario Ministry of Agriculture, Food and Rural Affairs (OMAFRA), and funded by Grain Farmers of Ontario, it is trying to unravel the mystery of the primary influences in production. It is also the focus of Matt Rundle’s master’s project, with the goal of examining the critical variables of soybean production during growth stages R2 to R5. Rundle has been working since 2021 with Drs. Hugh Earl, Dave Hooker, and Istvan Rajcan from the University of Guelph, and Horst Bohner from OMAFRA.
TABLE 1: 2023 COMBINED YIELD—ALL LOCATIONS
| Rank | Treatment (number, variety and type) | Yield (bushels/acre) at 13 per cent moisture |
|---|---|---|
| 1 | #6 “Everything, Variety C” (fertilizer, N and foliar fungicide) | 69.5 |
| 2 | #5 “Everything, Variety B” (fertilizer, N and foliar fungicide) | 69.0 |
| 3 | #7 “Everything, Variety A” (minus foliar fungicide package) | 66.6 |
| 4 | #4 “Everything, Variety A” (fertilizer, N and foliar fungicide) | 65.4 |
| 5 | #9 “Everything, Variety A” (minus fertilizer package) | 65.3 |
| 6 | #10 “Intermediate, Variety A” (half rates*) | 63.0 |
| 7 | #12 “Everything, Variety D” (fertilizer, N and foliar fungicide) | 61.8 |
| 8 | #8 “Everything, Variety A” (minus N package) | 58.3 |
| 9 | #2 “Control, Variety B” (uncreated check) | 58.0 |
| 10 | #11 “Control, Variety D” (untreated check) | 56.8 |
| 11 | #1 “Control, Variety A” (untreated check) | 56.5 |
| 12 | #3 “Control, Variety C” (untreated check) | 53.0 |
THE PROJECT PARAMETERS
The research plots were laid out in three locations each year, providing nine site years: at Bornholm, Elora, and Woodstock in 2021 and Elora, Woodstock, and Maryhill in 2022 and 2023. Three varieties (A, B, and C) were tested in 2021 and 2022; a fourth, longer-maturing variety (D) was added in 2023. Twelve different treatments were used (see Table 1), with four untreated checks, one intermediate (half-rates of fertilizer, nitrogen and foliar fungicide) and “everything” treatments on all four varieties.
IMPORTANT DETAILS
The R2 to R5 stages encompass flowering and pod set, and the research hopes to explain how that range determines yield, including pod numbers, seeds per pod, and seed size. Since 2021, Rundle has been tracking above-ground biomass, interception of incoming solar radiation into the canopy and greenness, among other characteristics.
Not achieving 100 bushels/acre yields or higher in soybeans will not make the project a failure, notes Rundle. The goal is to learn more that could be used in managing the crop, not to uncover some type of “silver bullet.”
The 2023 data were still being analyzed at the time of writing, but there are some visible results that could be shared from those plots. Although they were not what Rundle hoped to see in some treatments, there were some intriguing indications.
“There was a significant yield response to the ‘everything’ package with 61.8 bushels/acre over the ‘control’ at 56.8 bushels/acre within the longer maturity variety that we added in this year,” says Rundle, a corn product placement scientist with Syngenta Canada. “However, it was out-performed by a number of other treatments, including all three of our standard varieties with the ‘everything’ package.”
He concedes the results may not correlate to a set of agronomic practices that could translate to increased yields and revenues. But it is the physiological work that creates knowledge to build on for future practices or products being brought to market that might take advantage of some of the results they’re gleaning from this project.
THE REALITY OF THE SITUATION
Earl agrees with Rundle’s assessment: growers are more interested in defined practices that drive yield and less about the differences in pod number or seed size resulting from different fertilizer treatments.
“We have especially good statistical power to compare the ‘everything’ to the ‘nothing’ treatments because we have 12 estimates of each at each location,” says Earl, associate professor of crop physiology at the University of Guelph. “The contrast is significant at every location except Maryhill (in) 2022. As it turns out, looking at the input packages, the three varieties have statistically the same yield if you grew them without any of these inputs — then they all increase by about the same amount.”
He adds that each location is analyzed separately, so the least significant differences are location-specific. That way, a five bushel increase from foliar nitrogen was significant at Elora in 2021, but larger increases were not significant at Maryhill or Woodstock in 2022.
TAKE HOME MESSAGE
Despite the preliminary nature of the data, the lesson to be carried forward from Earl’s perspective is that if a grower’s getting very high yields, it’s likely because they’re on good soil and saw good weather during a growing season.
“It’s almost like it’s an innate property of your farm,” he says. “Some growers on Class 2 and 3 soils will say the soil is a lot better than it was when they got it, so through proper management, you can increase the soil productivity. But that’s a long-term prospect.”
This project is funded in part by the Canadian Agriculture Partnership (CAP), a five-year investment by Canada’s federal, provincial, and territorial governments. •


