The Crop Heat Unit system
50 YEARS OF RELIABLE RATINGS
THE MAN WHO came up with Ontario’s renowned Crop Heat Unit (CHU) system admits a little luck along with ten years of research led to its development. Considered the gold standard for helping farmers choose corn hybrids that are most suited for their area, the CHU system developed by Dr. Murray Brown was first adopted 50 years ago in 1964.
“At that time, corn hybrids were expanding in numbers that you wouldn’t believe but there were very few hybrids on the recommended list in 1963,” recalls Brown, a retired Professor from the University of Guelph’s School of Environmental Sciences.
Prior to the CHU system, a map with five zones was used for corn recommendations. Long-season varieties were recommended for Zone 1 in the southwest with shortest-season hybrids suggested in Zone 5.
“It was general, and farmers had to kind of guess what hybrids should go into each of the zones,” says Brown, who was a Research Fellow at the Ontario Research Foundation in Toronto at the time he recommended the CHU system to the Ontario Corn Committee.
DEVELOPING A NEW SYSTEM
The CHU ratings for hybrids are based on the total accumulated CHUs for the frost-free growing season in each area of the province. Because corn development varies with temperature, Brown based the ratings on this relationship. The relationship used for daytime temperatures caught his attention when reviewing a paper while working on his PhD. The paper was actually about growing soybeans in a growth chamber at different temperatures.
“It showed that when you got up to 86 Fahrenheit or 30 Celsius, that it was the fastest rate of development for soybeans,” says Brown, noting the chance to review the paper was a lucky break. He then worked out the system based on how the crop responds to temperatures.
To summarize the system, the daily crop heat units are calculated from minimum and maximum temperatures with separate calculations for day and night. The daytime relationship sets the minimum at 10 C because the crop does not develop when the daytime temperature falls below that mark and the maximum at 30 C. The night time uses 4.4 C as a base with no optimum.
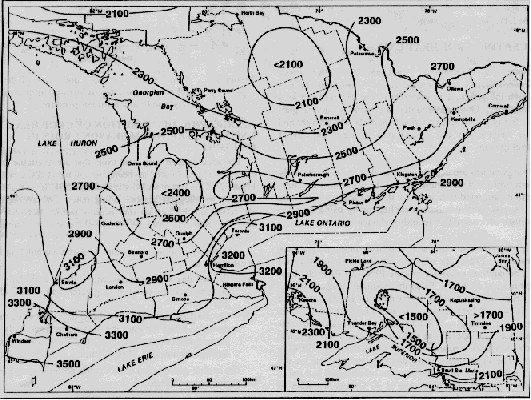
The two daily values are calculated using an equation and are averaged to provide a CHU rating for each day during the corn growing season, which are summed for the climate stations in each region of the province. The heat units based on the temperature data are then mapped with contours drawn to show the available heat units in each area.
FIELD RESEARCH
Brown’s research into the idea began in 1953 when he was hired by the Ontario Research Foundation to study the expansion of soybeans across Ontario and to determine if the zonal map that was used for crop recommendations could be improved. He ran experiments and used climatic data from Harrow all the way up to the Dundalk Highlands in Dufferin County.
“I toured Ontario, talking to farmers about growing soybeans and all this work led up to the paper I reviewed,” says Brown.
The system was quickly approved by the Ontario Corn Committee at a meeting in Chatham in December 1963. Since the first available data for the system was from 1963, the first year it was used for hybrid ratings was 1964. The system was well-received by farmers like Don Hill, who farms in Grey County, near Owen Sound.
“We desperately needed a system because you couldn’t accurately match hybrids to your growing conditions before,” recalls Hill, who was working for the Soil and Crop Branch of the Ministry of Agriculture at the time.
In addition to having an effective rating system for the corn hybrids, Hill notes that it was important for farmers to keep track of the heat units accumulated on their farms.
“You had to have those variety trials across the province to find out how many CHUs a variety really needed,” says Hill. “Then once you had that, and you knew what the CHUs were going to be where you farmed, you could match the hybrids pretty well.”
IMPROVING THE SYSTEM
The system has been tweaked over the years – such as updating the climate data with recent records and changing the beginning and ending of the season for CHU accumulation. The current map for the Ontario Corn Performance Trials starts accumulation of CHU on May 1 each year for all climate stations. For the original map that was developed in 1964, CHU accumulation started on the date that the mean temperature was 55 F (12.8 C). The end of the season is now the first occurrence of -2 C, whereas the date used for the original map was the 10% chance of 32 F (0 C) at each climate station.
These changes have resulted in the map showing a greater number of CHU available. Brown notes that climate change over the last 50 years may have partially contributed to increasing the CHUs as well.
Andy Bootsma, an agroclimatology consultant in Ottawa who worked with Brown, says another key change was the addition of more information related to the risk level of heat units. Using an 80% probability as an example, the data would show how many heat units can be expected eight years out of 10, rather than showing an average over 30 years.
“If you didn’t want to take a big risk that the crop doesn’t mature in a cool year and you wanted to be sure it’s properly mature at harvest time, you could use the 80% Corn Heat Unit value,” says Bootsma.
LASTING IMPACT
Brown’s CHU system continues to be recognized as one of the best methods to quantify the effect of temperature on crop development. Dr. Thijs Tollenaar, a retired Professor of corn physiology at the University of Guelph, recently compared it to other methods and found the CHU system outperforms the others. Tollenaar and his colleagues presented a paper on the comparisons of several Thermal Unit systems at the American Society of Agronomy Annual Meeting last (see sidebar) fall and are preparing to have the study published.
GETTING MAIZE PHENOLOGY RIGHT
Dr. Thijs Tollenaar
“Arguably, the greatest impact of temperature on maize yield is through its impact on phenology. Phenology influences the duration of the life cycle and the timing of important stages of development that are critical in terms of yield formation and climate. Thermal functions have long been used to account for temperature effects on rate of development. The objective of this study was to determine how well current thermal functions quantify maize phenology, and whether this is dependent on (i) the phase of development, (ii) the relative maturity of the hybrid, and (iii) the ambient temperature distribution. Eight thermal functions were evaluated across a number of diverse public and private data sets. For each function, thermal accumulation was calculated from planting to anthesis (or silking), and from silking to black layer formation. Results showed that prediction of the planting to anthesis (or silking) period was more precise for thermal functions than for calendar dates, non-linear methods were generally more precise than the linear methods, Crop Heat Units was overall the most precise method, and thermal functions performed similarly among hybrids ranging in Relative Maturity(RM) ratings from RM76 to RM120. Hybrid-locations were predicted generally more precisely in the higher RM groups grown at more southern locations in the North American Corn Belt data set, whereas predictions were poorest for the late planting dates in the Argentinean data set. The period from silking to physiological maturity was generally poorly quantified by the tested thermal functions and were less precise than calendar days, with the exception of the General Thermal Index. The impact of photoperiod, temperature and solar radiation on duration of phases as measured in thermal units was evaluated.”
Abstract of the presentation provided at the annual meeting of the American Society of Agronomy in November 2013. •


