Understanding precision agriculture
DO SOMETHING WITH YOUR DATA
“I’VE BEEN COLLECTING all of this yield data from my combine… now what do I do with it?”
It’s a question Dr. Mike Duncan hears often. But it’s one that he and his research team at Niagara College are working to answer, by giving growers a place to upload, store, and — most importantly — put their data to practical use.
Duncan, an NSERC industrial research chair, along with Sarah Lepp, senior research associate, and their team have been working with researchers from the Precision Agriculture Advancement for Ontario (PAAO) project to create and develop the Crop Portal.
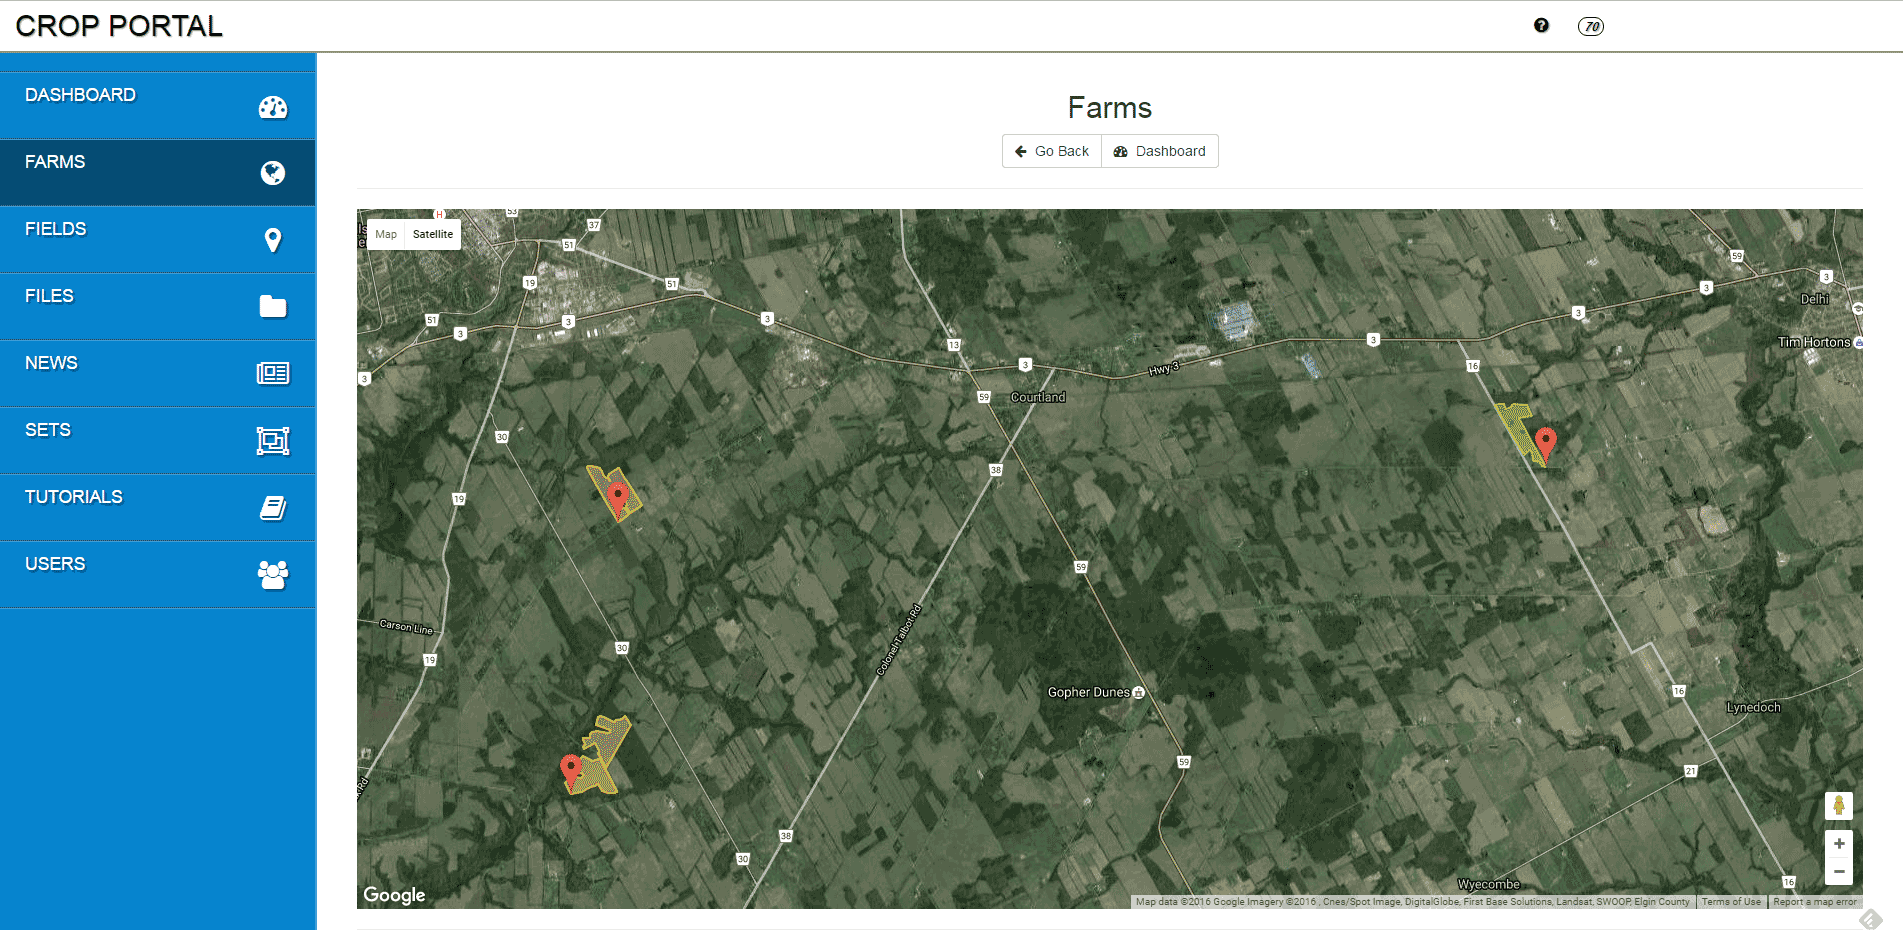
For growers collecting memory cards and hard drives full of raw data each season, the Crop Portal works as an online repository that lets them upload that data and then get it processed and transformed into useable maps that help identify the high, medium, and low-yielding areas of their fields.
Duncan and Lepp hope the Crop Portal will help growers get past the idea that processing and mapping out yield data not only demands specialized training, but also a big investment in time and software.
“A lot of guys don’t want to have to be IT specialists; and if they can’t run a piece of software off their iPad, they’re probably not going to use it,” Duncan says. “You’re also looking at spending several thousand dollars on software, and if you’re running low acreages, it’s a high cost per acre for processing data.”
TECHNOLOGY AND PRIVACY
Duncan and Lepp want the Crop Portal to be seen as a quick, simple, and straightforward online tool that growers — working with crop advisors — can use to manage their data.
“We want to keep growers moving, so that they can upload their yield data, view it, and then move on to the next part of their day,” says Lepp.
Lepp adds that growers own all of the data they upload to the Crop Portal, and are the only people allowed to see or do anything with that data. Even if growers don’t want to work with data themselves, crop advisors can set up Crop Portal accounts on a grower’s behalf so they can access and work with their client’s data.
What growers don’t need to worry about is their data being sold or shared with other companies or agencies.
“Data privacy and data ownership is key for us,” Lepp explains. “We can only view or work with your data if you give us permission to. Otherwise, Niagara College Research and Innovation never owns any data.”
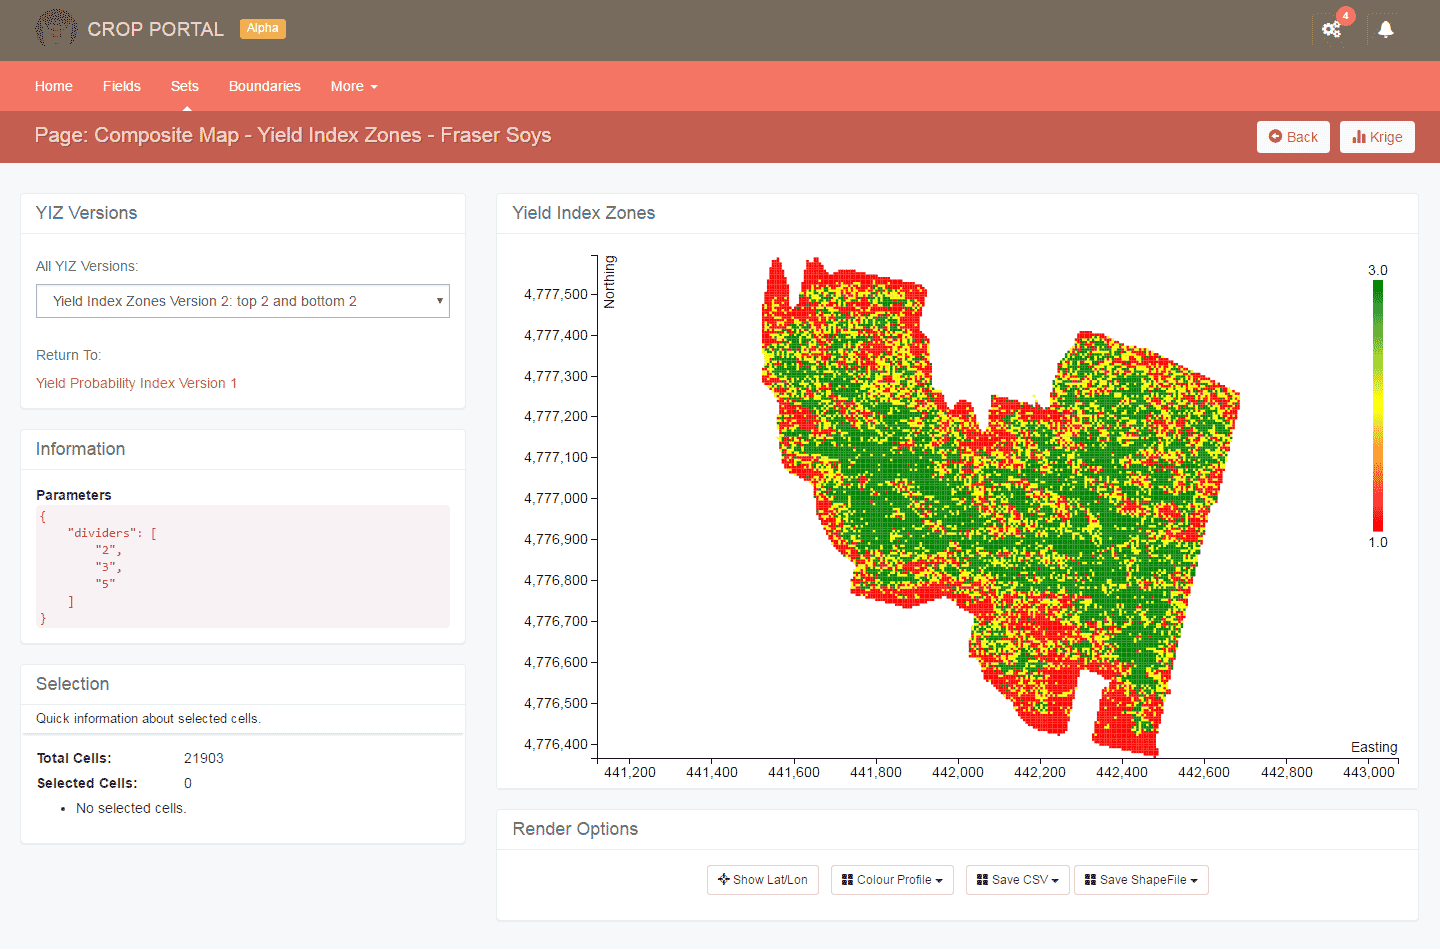
After uploading raw yield data to the Crop Portal, growers get a basic visualization of the data points called a Yield Probability Index (YPI). This YPI uses a green to red colour scheme to give growers a sense of the high, low, and medium-yielding points within their field boundary.
“Seeing the YPI is really that first step in gaining an understanding of the best and worst-performing areas of your field,” explains Lepp.
Growers that have collected elevation data can also have the Crop Portal perform a basic landform analysis that links their yield numbers to the higher knolls and lower-lying areas of the field.
GRAPH 1: CROP PORTAL, YPI.
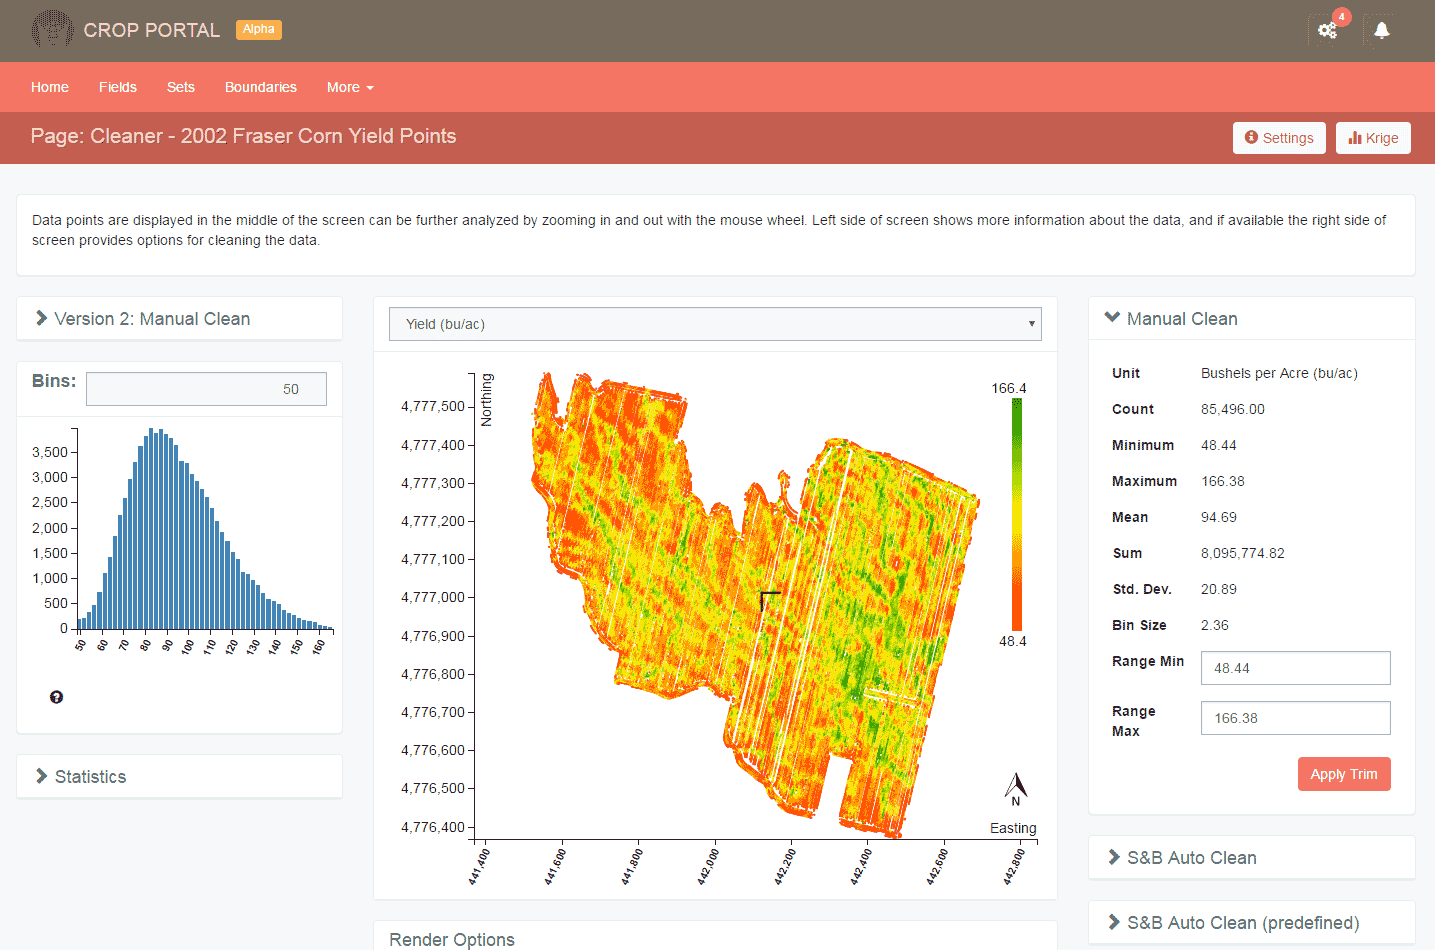
GRAPH 2: CROP PORTAL, CLEAN POINTS.
CLEANING
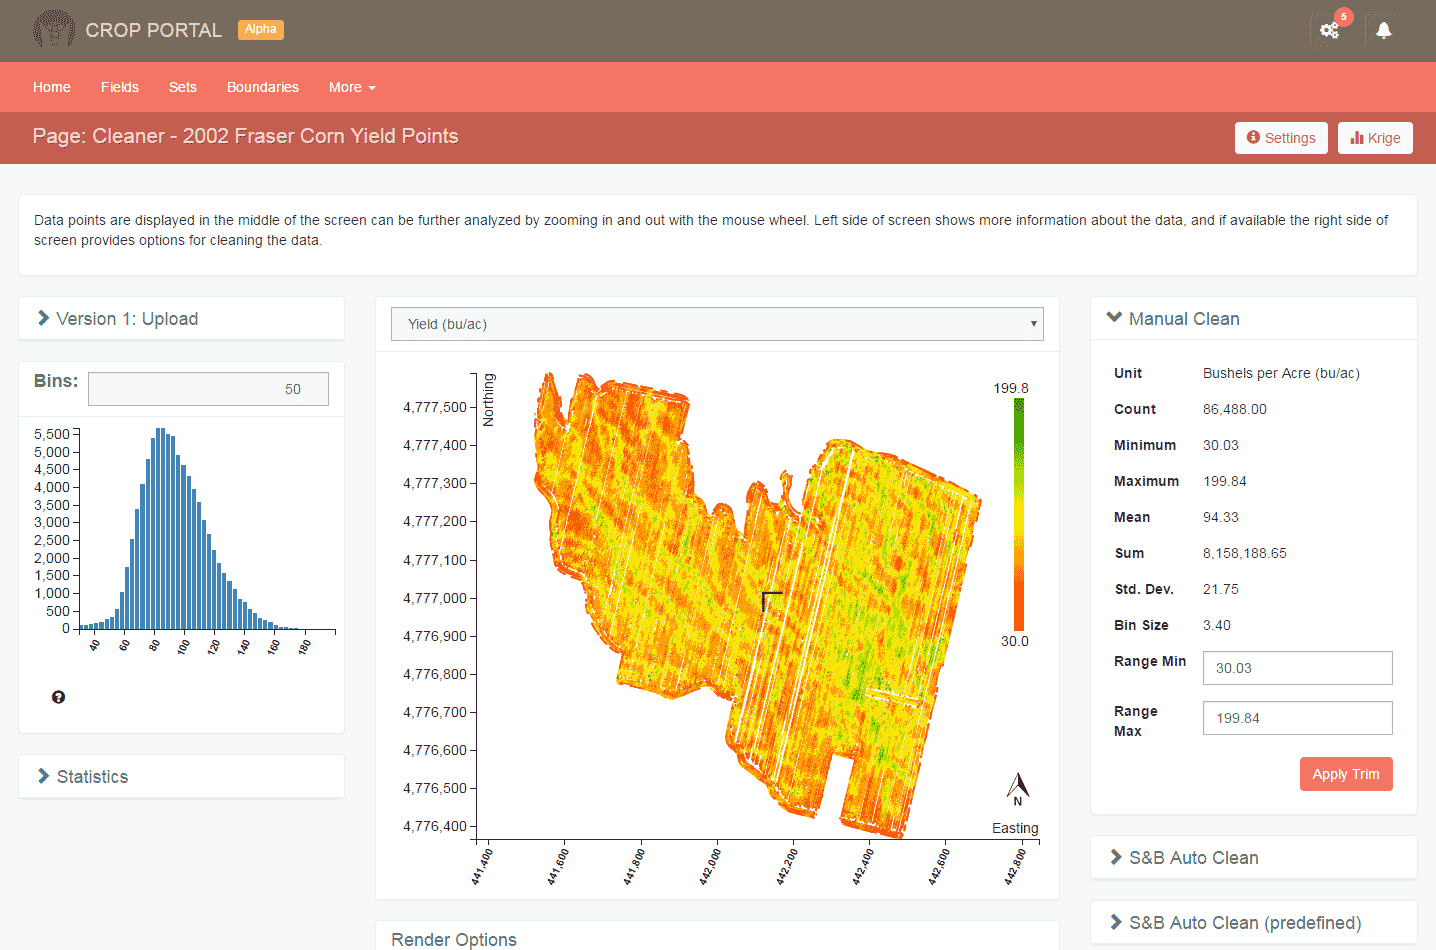
From the initial YPI visuals, growers can go a step further and use a set of computer algorithms within the Portal to “clean” their data by removing unusually low or high yield numbers that tend to crop up when data is being collected by the combine.
“Having to clean data is just what naturally happens when you run a combine in a field,” explains Duncan. “You have to stop and turn around in certain areas or you’re going to run into the weeds, you could be driving through the headlands where there’s no yield, or you could get digital glitches that show up as a massive 140,000 bushel-per-acre spike.”
All of these different factors create inaccurate numbers that growers need to remove from their field’s data set, as their actual yield numbers could be getting biased up or down.
“Data cleaning really pushes you to take a more critical look at what’s happening with your field performance,” says Lepp. “Being able to go in and assess, see your highs and lows, and get a sense of what’s realistic for your fields is huge.”
Duncan adds that knowing where the consistently low-yielding areas are in a field is a first step, but then growers need to go in at ground level to understand why those areas are underperforming. The next step would be to get a soil test, and look at the soil profile and texture to find out if there are other agronomic issues present, such as weed escapes.
GRIDDING
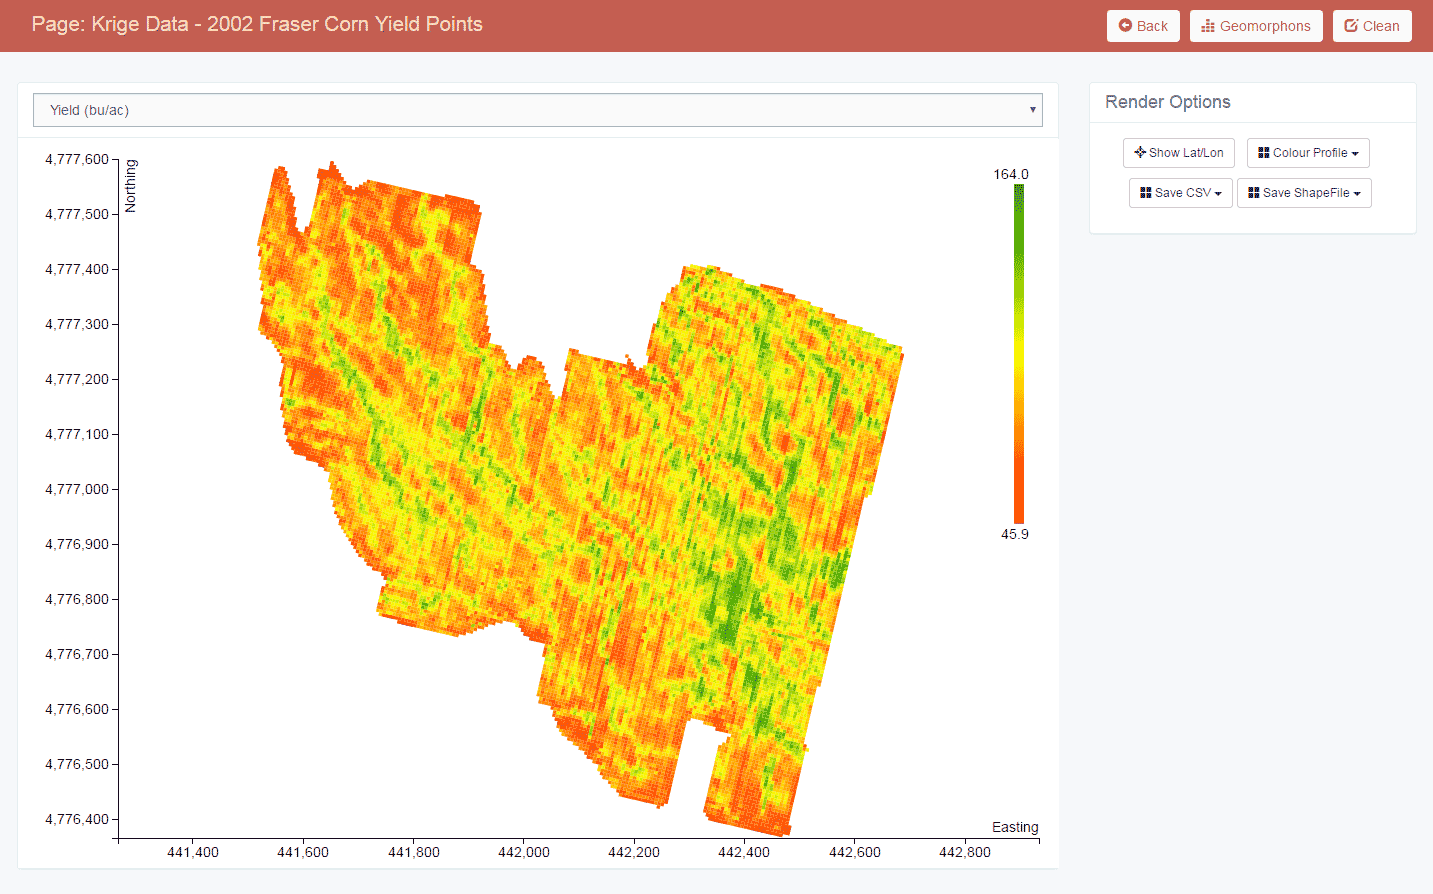
Once the data’s cleaned, the next major step in the Crop Portal process is what Duncan and Lepp call “gridding”. This involves setting out the data on a map grid as several hundred (or thousand) small, fixed “cells”, or GPS-mapped areas within the field.
GRAPH 3: CROP PORTAL, GRIDDED.
GRAPH 4: CROP PORTAL, RAW POINTS.
Gridding the data creates a consistent set of points linked to coordinates that growers can call up and look at individually.
The Crop Portal also lets growers stack gridded maps from multiple years — all using the same, fixed cells — on top of each other to see if there is stability to the maps over time as a whole, or by looking at individual crops — such as corn and wheat — in their rotation.
In looking at several years of grower-supplied yield data, the Crop Portal researchers have found that corn and wheat yield responses are similar across many fields. This means that corn and wheat yield numbers could be stacked to provide multi-year data. However, the researchers also found that soybean yield responses were quite different, or the total opposite of corn and wheat.
“Guys who want to create variable rate prescription maps can look at the cells for a specific area of the field and see how they’re responding to a number of variables, such as seed population densities or nitrogen applications,” says Lepp.
So, what does the not-too-distant future hold for the Crop Portal?
According to Duncan, a big piece of the online portal’s success will depend on growers’ willingness to collect and carefully preserve their raw data so that it can be put to use.
“If growers want to get the full value from their data, then they have to put in the effort to label and organize their hard drives or SD cards in a way that they can know when it happened, and in which field,” he says.
GRAPH 5: CROP PORTAL, ZOOMED IN.
Another option — and an additional security step — would be for growers to backup the data from their hard drives onto a secure server.
In the meantime, Lepp says she and the team are currently developing a new version of the Crop Portal with an eye towards making the program even more immediate and user-friendly.
“One of the first steps after a farmer has collected their yield data, is that they need a quick and easy way to do something with it,” she says. “Our goal is to make such a small footprint in a farmer’s day so that they can invest five or 10 minutes to get a huge amount of value.”
This project was funded in part through Growing Forward 2 (GF2), a federal-provincial-territorial initiative. The Agricultural Adaptation Council assists in the delivery of GF2 in Ontario.
Precision Agriculture Advancement for Ontario: This article is part of a series dedicated to helping farmers understand and implement precision agriculture technology. It is based on research conducted by Nicole Rabe, Ian McDonald, and Ben Rosser at OMAFRA, in conjunction with Mike Duncan,?Sarah Lepp, and Gregor MacLean at Niagara College.
For more on precision agriculture go to: www.gfo.ca/Research/Understanding-Precision-Ag. •


