Market side: Futures trading basics
LESSON 36: TECHNICAL ANALYSIS

CANDLESTICK CHARTING
Tweezer patterns — The tweezer pattern is a minor trend reversal pattern that consists of two candles that exhibit almost exactly the same high or low depending if it is a downward move or an upward move. Unlike most candles, where the body of the candle is the more important part, the tweezer candle formation puts more emphasis on the shadow or wick of the candle. If the tweezers appear in an uptrend, it’s called a tweezer top; and if it appears in a downtrend, it’s called a tweezer bottom and should have the same low. An ideal pattern for the tweezer reversal should have the following characteristics.

In a Tweezer top the first candle should have a large real body confirming the uptrend while the second candle should have a shorter real body and possibly an opposite colour. The highs of either the shadows or the real bodies of both candles should be the same in terms of value. Another confirming signal for this pattern would be if the pattern appears near another top or resistance or down-trend line, thus confirming overhead resistance and a technical area of resistance.
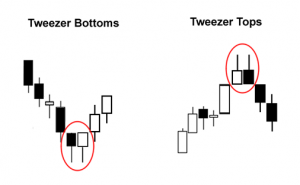
In the tweezer bottom, which appears in a down-trend, the first candle should be black or red depending on the colour scheme being used with a large real body. This downward movement is confirming the downward move. This should be followed by a bullish or white or green candlestick with a shorter real body. The two candles should have either the same lows or the bottom of their real bodies should be the same level. Of course, like the tweezer top confirmation, it would be a stronger signal if the tweezer bottom appeared either at a recent bottom support or at a trend line.
A tweezer top or tweezer bottom candle formation is considered a reversal pattern. This reversal could be of any timeframe as it is equally effective on a one hour candle chart as it is on a daily or weekly candle chart. •
| Lesson Definitions: Continuation pattern: A technical analysis pattern that suggests a trend is exhibiting a temporary diversion in behaviour, and will eventually continue on its existing trend. Continuation patterns include flags and pennants. Reversal pattern: A reversal pattern is one that suggests major resistance or support has been encountered and the current trend could possibly reverse course. This is true on all timeframes from hourly to daily and weekly charts. Examples of a reversal pattern include ‘head and shoulders’ and double and triple tops and bottoms. |
Marty Hibbs is a 25 year veteran futures trader, analyst, and portfolio manager. Hibbs was a regular guest analyst on BNN for four years. He is currently a grain merchandiser with Grain Farmers of Ontario.
DISCLAIMER: This information has been compiled from sources believed to be reliable, but no representation or warranty, express or implied, is made by the author, by Grain Farmers of Ontario, or by any other person as to its accuracy, completeness or correctness and Grain Farmers of Ontario accepts no liability whatsoever for any loss arising from any use of same.