Canadian Field Print Initiative
THERE IS A GOOD STORY TO TELL
THE AGRICULTURAL INDUSTRY has always taken pride in the fact that we are doing a good job to protect the environment. But in an ever-increasing world of transparency, are we as an industry able to confidently communicate the good job we are doing? On top of that, are we able to track our ongoing improvements to show our commitment to improving?

We know that processors, end users and retailers are investing in sustainability through the setting of internal sustainability targets. Consumers are also increasingly concerned about the environmental sustainability of the products they consume.
Grain Farmers of Ontario along with other industry partners, including Pulse Canada, CropLife Canada, Fertilizer Canada, Canadian Canola Growers, and Manitoba Soybean and Pulse Growers, have created the Canadian Field Print Initiative (CFPI). This partnership has developed key on-farm sustainability metrics to help tell a story of farm sustainability across Canada.
As part of the CFPI, two main deliverables were achieved. The first was to create a Canadian indicator report to highlight a macro level view of Canadian crop production using census derived data. The second was to create a farm calculator tool to assess environmental sustainability based on four indicators: Land Use Efficiency, Energy Use, Climate Impact, and Soil Erosion Risk.
As a result, we now have market-driven, science-based, and outcomes-based metrics to communicate sustainability.
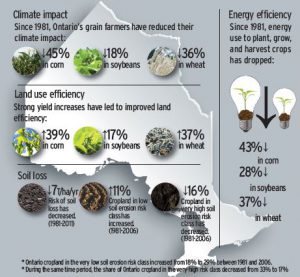
LAND USE INDICATOR
The Land Use Indicator is something that is important when assessing how efficient we are within the land we farm. As an inverse of yield, it provides an opportunity to showcase how we have consistently improved our efficiency by producing more. We have been able to quantify land use efficiency in corn, soybean, and wheat production showing the strong improvements we have made.
Since 1981, Ontario’s grain farmers have improved their land use efficiency by 39% in corn, 17% in soybeans, and 37% in winter wheat.
SOIL LOSS INDICATOR
The Soil Loss Indicator looks at the risk of soil loss and reports the total soil loss (tonnes/ hectare/year), encompassing water, wind, and tillage erosion indicators. Soil health is becoming a topic that the supply chain is increasingly concerned about and soil loss is an integral part to achieve healthy soils.
The risk of soil loss on Ontario cropland has fallen from about 27 tonne/hectare/year in 1981 to just over 20 T/ha/year in 2011.
ENERGY USE INDICATOR
The Energy Use Indicator helps to quantify the amount of energy used to plant, grow, and harvest a crop. There is increasing interest from the supply chain on the amount of energy used on farm. This energy use indicator helps to showcase our improvements in energy use efficiency. Crop production involves many uses of energy, ranging from the production of crop inputs and machinery to the burning of fuel to perform field work. The energy use indicator estimates farm energy use from: fuel for farm field work (tillage, seeding, manure/fertilizer application, spraying, harvesting), fuel (gasoline/diesel) for farm transport vehicles, electricity, heating fuel, production of fertilizer and pesticide, and production of machinery. We have been able to quantify what the energy efficiency improvements of corn, soybean, and wheat production are and the ongoing improvements we have made.
Since 1981, energy used to plant, grow, and harvest crops has dropped by 43% in corn, 28% in soybeans, and 37% in winter wheat.
CLIMATE IMPACT
Companies are constantly looking to assess and track the climate impact of a product or process. Through this initiative, we have been able to quantify what the climate impact of corn, soybean, and wheat production is and the ongoing improvements we have made in this area.
The climate impact indicator includes everything in the energy use indicator (all the energy required to plant, grow, and harvest a crop), but converted to CO2 equivalents. It also includes Soil Organic Carbon (SOC) changes from tillage, direct N2O emissions from fertilizer application, N2O emissions from residue decomposition, and potential indirect N2O loss through leaching or volatilization. All of these variables are converted to CO2 equivalents to give a climate impact for the crop.
Since 1981, Ontario’s grain farmers have reduced their climate impact by 45% in corn, 18% in soybeans, and 36% in winter wheat.
This is a good story to tell; but we cannot accept this as being good enough. Part of the sustainability journey is driving forward and continually improving. It is our job as an agricultural industry to continue the great progress we have made — innovating, improving, and driving the industry forward.
For more information on the Canadian Field Print Initiative go to www.fieldprint.ca.
Michael Buttenham is the market development coordinator — sustainability and environment for Grain Farmers of Ontario.
This article features a Grain Farmers of Ontario Market Development-Sustainability initiative. •