Carbon footprints 101
UNDERSTANDING EMISSIONS ON ONTARIO’S GRAIN FARMS
TO REDUCE GREENHOUSE Gas (GHG) emissions you need to understand where and how you are emitting. Canada’s National Inventory Report, as reported by the Government of Canada, tracks and reports Canada’s GHG emissions across sectors. While this can provide great insights into our GHG impact on a sector by sector basis, it does not provide a detailed understanding of the GHG emissions of a specific product or process.

With a greater emphasis on reducing GHG emissions, consumers and companies are increasingly interested in the GHG emissions of a product, practice, or event through product carbon footprints.
WHAT IS A CARBON FOOTPRINT?
A carbon footprint can be defined as the total GHG emissions caused by an organization, event, product, or individual. Carbon footprints are a standard approach to measure, manage, and communicate GHG emissions related to goods. A carbon footprint is based on a life cycle assessment (LCA) but focuses on a single issue which is climate change. Carbon footprints follow specific standards to ensure consistency with reporting.
Companies are increasingly looking to measure and communicate GHG emissions of a product. An example of a carbon footprint could be the GHG footprint of producing a loaf of bread. This would include all processes from the farm producing wheat, to the flour mill, and the bakery.
CROP CARBON FOOTPRINTS
Through the Canadian Roundtable for Responsible Crops (CRSC), carbon footprints were produced for 10 grains and oilseeds across Canada. These crop carbon footprints calculate the GHG emissions of crop production from planting a seed until it reaches a grain bin. The CRSC crop carbon footprints do not go beyond the farm gate but are the first step in being able to create a product carbon footprint like the example of a loaf of bread.
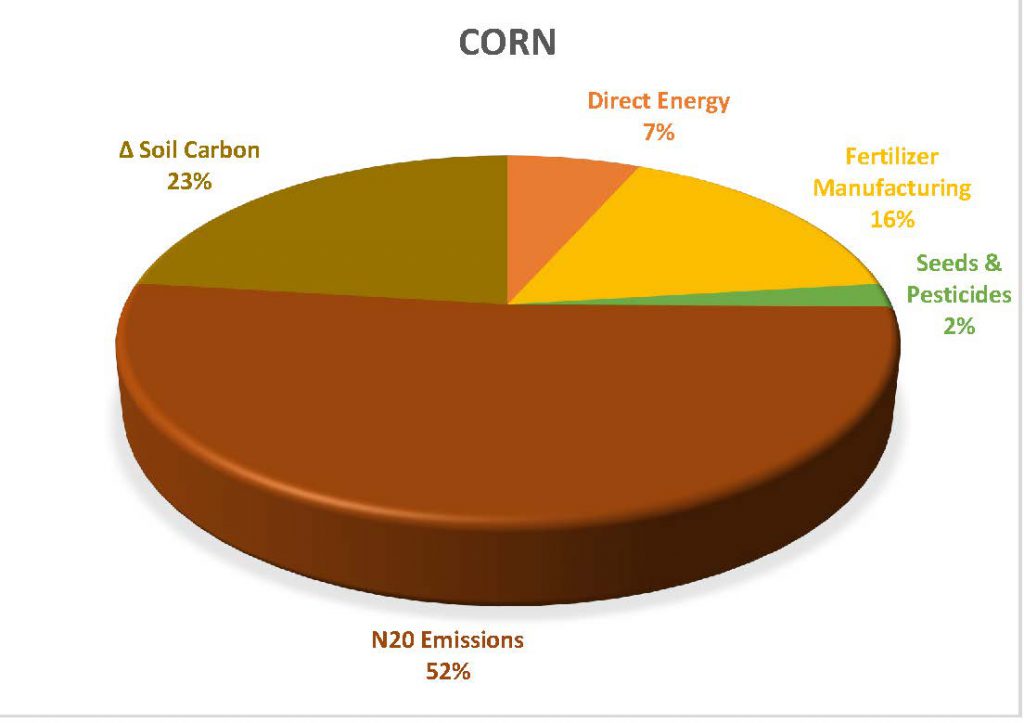
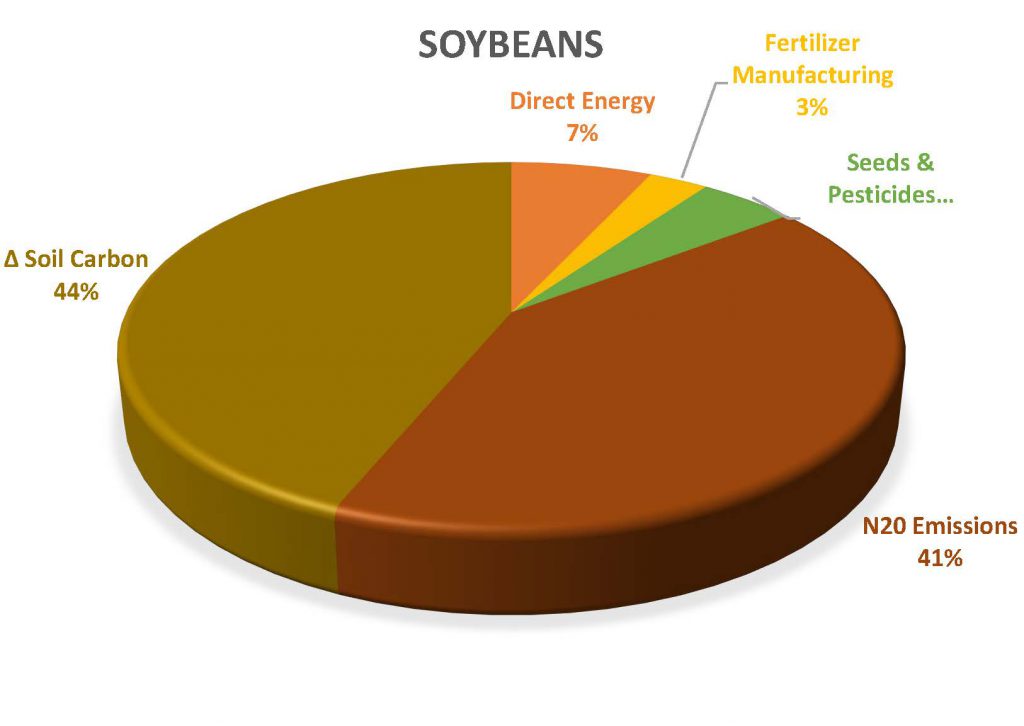
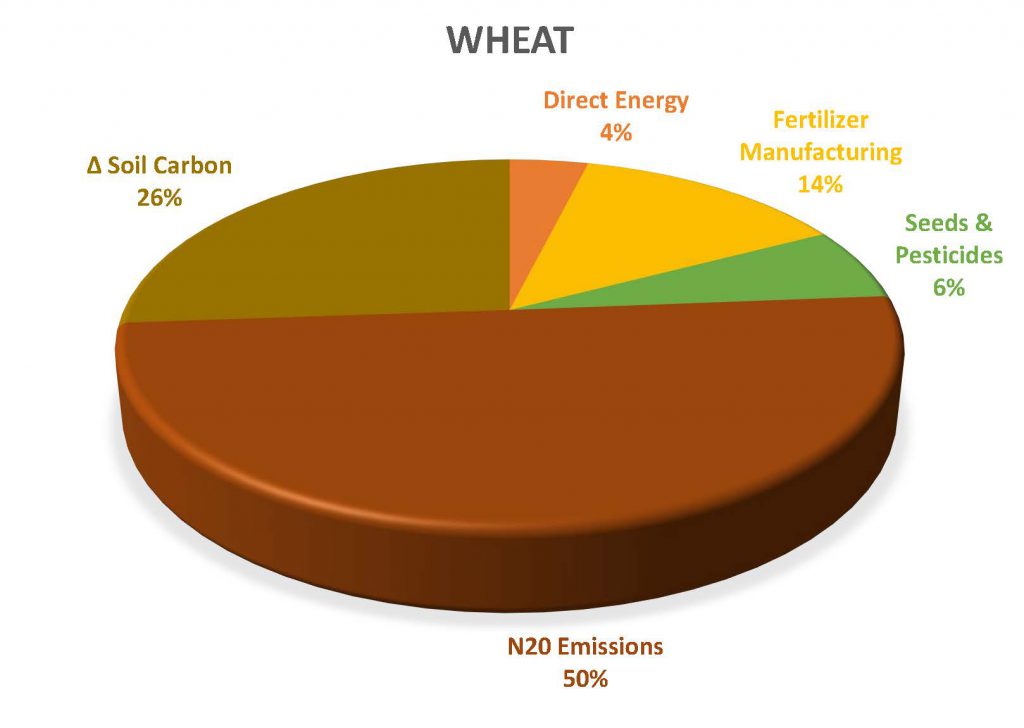
Determining the carbon footprint of crop production requires information on crop performance, production practices, crop inputs, soil, and climate parameters. This does not require direct farmer information but takes an average of that crop’s production practices in a particular region. Production practices include fieldwork, potential irrigation, grain drying, and storage. The carbon footprint examines areas of crop production which emit GHGs including:
- Direct on farm energy use (crop production, irrigation, and grain handling)
- Fertilizer manufacturing
- Seed and pesticides manufacturing
- Direct N2O emissions from soils (nitrogen fertilizer and manure application, crop residue decomposition, N mineralization where soil organic carbon has been lost, and changes in tillage practice)
- Indirect N2O emissions associated with volatilization and leaching (commercial fertilizer and manure application)
- Soil organic carbon changes due to conversion from perennial to annual crops, change in tillage practices, and change in area of summerfallow.
MARKET DEMANDS
Government — Governments around the world are placing added emphasis on reducing GHG emissions including Canada. After signing on to the Paris Agreement, which is an international framework that looks to combat climate change, Canada has committed to reducing its GHG emissions by 30 per cent below 2005 levels by 2030. Most recently, the Clean Fuel Regulation looks to biofuels such as ethanol to reduce GHG emissions in our transportation sector. As a result, the carbon footprint of ethanol production, including corn feedstocks, are essential to communicate how ethanol reduces GHG emissions in fuels.
Supply Chain — Companies are increasingly interested in the GHG emissions within their supply chains. Walmart recently established Project Gigaton which looks to work with their supplier to reduce emissions by one gigaton (one billion metric tons) by 2030. Agriculture is one of the areas that is identified and through the adoption of agricultural best practices, including precision agriculture and feed optimization, there is a potential to reduce GHG emissions. Other companies such as General Mills have also made commitments to reducing GHG emissions. Over the next decade, General Mills has committed to reducing absolute greenhouse gas emissions by 30 per cent across its full value chain.
ONTARIO’S CROP CARBON FOOTPRINT
The CRSC has produced carbon footprints that reflect the production of barley, corn, oats, soybeans, and wheat in Ontario.
HOW ARE WE IMPROVING?
While farmers are not directly responsible for all emissions within the carbon footprint, we do have potential control over certain practices and processes. As an organization, Grain Farmers of Ontario is working on many initiatives that all work towards improvement. Long term investments in research in agronomy, including soil health, cover crops and crop rotation, assist in improving on-farm profitability and our GHG footprint. Other initiatives such as the 4R Nutrient Stewardship program are also working towards improving nutrient use efficiency and reducing our environmental footprints. Individual farmer practices and evolution in tillage and technology such as nitrogen inhibitors are all areas that help tell our story. While there is not a one-size-fits-all solution, there is a suite of things we are working on to better tell our carbon footprint story and show these measurable improvements.
Whether corn used in ethanol, wheat used in bread, or soybeans used in vegetable oils, there is a story behind these products and their footprint. Consumers and market demands are beginning to ask more about individual products and the sustainability behind them. The added level of transparency that crop carbon footprints can provide will help shape our story and provide customers and markets with information on how our crops are produced. With practices and research in the areas of soil health and the 4Rs, we are positioning ourselves well to better understand our impacts but also show measurable improvements both economically and environmentally.
Michael Buttenham is the sustainability and environment coordinator for Grain Farmers of Ontario. •