Optimum Corn N Rate
AGRONOMIC INFORMATION FROM ONTARIO'S CROP SPECIALISTSAGRONOMIC INFORMATION FROM ONTARIO'S CROP SPECIALISTS

THERE ARE MANY tools available to guide nitrogen (N) rate decisions, but nothing beats good on-farm N response data. These three methods might assist in determining how close your corn N rates are to the optimum.
MULTI-RATE N TRIAL
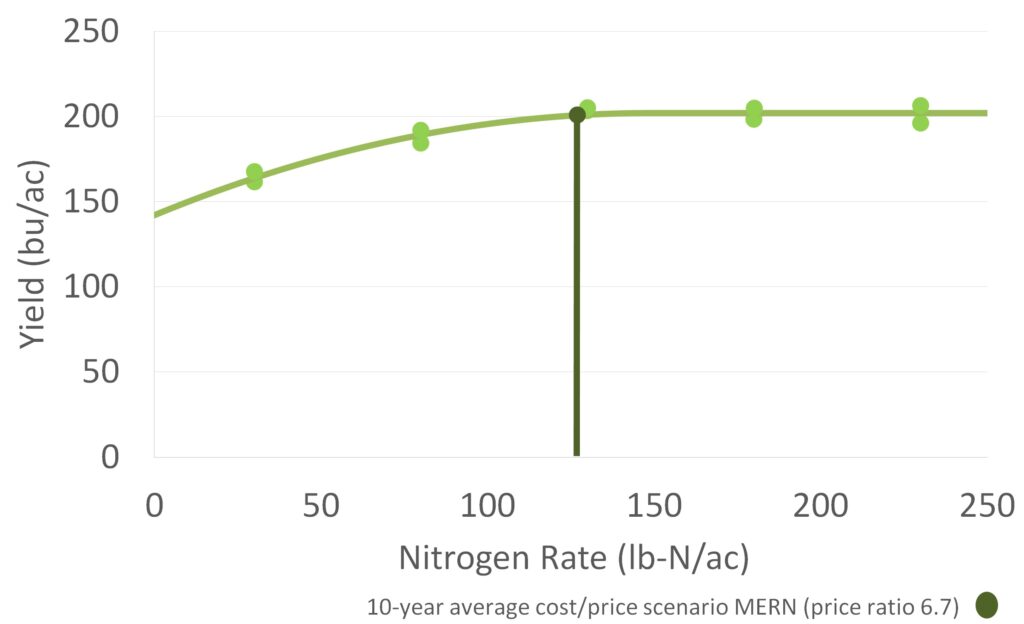
The gold standard is the multi-rate N trial. Several N rates are applied from zero to a non-limiting rate (e.g., 200-250 lb-N/ac), and an N response curve is generated (Figure 1). Optimum N rates typically occur a little before yields plateau.
Pros
• Most accurate method
Cons
• Requires several N rates (lots of plots)
• May include N rates with yield losses
• Statistical software required to fit yield response curves
DELTA-YIELD ESTIMATION
A shortcut to the multi-rate N trial is the delta-yield estimation method using the “N-Rate Evaluator” tool at www.gocorn.net (Figure 2). This method only requires two rates: a zero-N rate and a non-limiting N rate (Figure 3).

The yield difference (“delta-yield”) between these treatments allows us to estimate the optimum N rate based on relationships established in historical Ontario N datasets.
Pros
• Requires only two N rates
• Provides a reasonable estimate of the optimum N rate
Cons
• Requires a zero N rate (yield loss)
THE “+/- 30-LB” TEST
The simplest method is likely the “+/- 30-lb” test. This test involves testing N rates slightly higher and lower than the normal field N rate to see if yields respond. It will not deliver an optimum N rate like the first two methods but can indicate whether normal field N rates might be high, low, or about right.
Pros
• Require only two additional N rates
• Does not require low N rates (minimal yield loss)
Cons
• Does not provide an optimum N rate
Optimum N rates vary year-to-year and spatially across fields. One test in one year indicates what worked in that spot for that year, but replication of N tests over time and space is critical for confident decision-making. •