Estimating nitrogen requirements based on yield response
NEW TOOLS ARE AVAILABLE TO HELP MAKE NITROGEN MANAGEMENT DECISIONS
in the past, most of the information regarding nitrogen rates for corn has focused on estimating or predicting how much you need to apply as you look forward to the upcoming growing season. This generally meant utilizing the Nitrogen Calculator or Soil Nitrate Testing as tools to get the rate right for a given farm or field.
One of the challenges with improving your nitrogen management strategy is the near impossibility of looking back to assess how accurate you really were. Perhaps in some years if you get a lot of mid-August leaf firing or if your yields are lower than expected you might blame it on a nitrogen rate that was too low. But did you miss the right rate by ten pounds or 70 pounds? It is very tough to tell.
Discovering the optimal nitrogen management strategy may be as easy as a simple field test. Outlined in this article is a simple tool for looking back and evaluating nitrogen strategies.
gathering the data
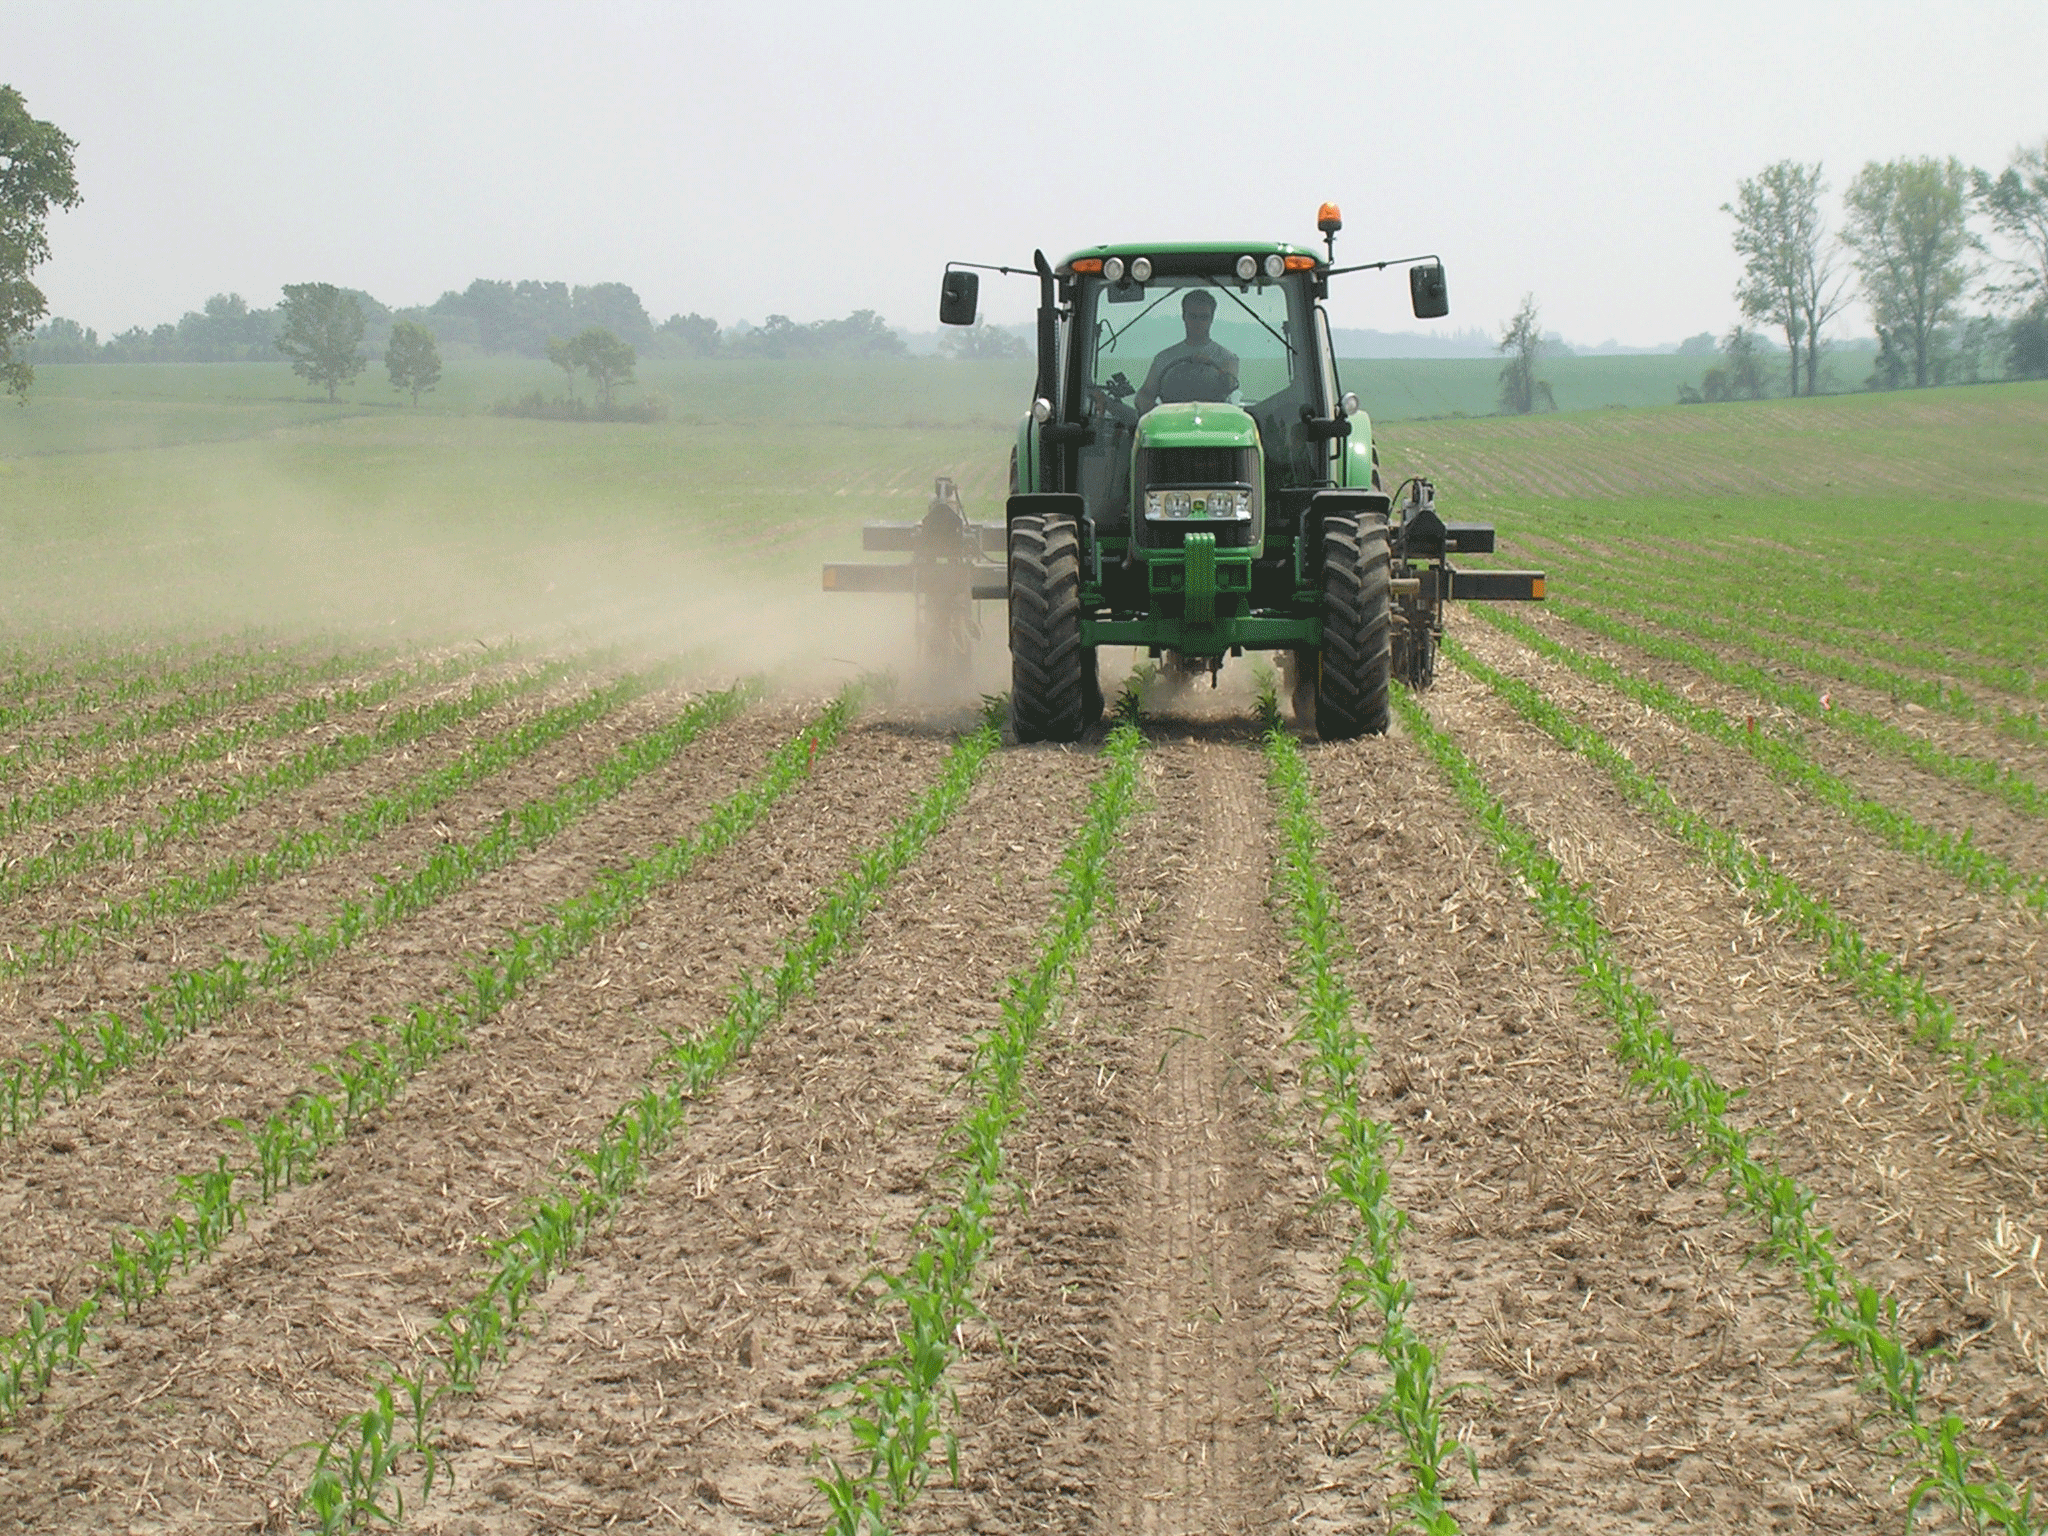
On average, larger yield responses to fertilizer nitrogen are associated with higher fertilizer nitrogen needs to produce maximum economic yields. This concept is intuitive; consider two strips running through a field, one with no nitrogen (or perhaps just starter nitrogen) and a second strip with what you would consider a non-limiting rate. If the yield difference or response to nitrogen is very small then you are confident that the correct rate for that field is low, perhaps zero. However, if the yield difference between the two strips is very large then you understand that that the optimum nitrogen rate for the field is much higher, tending towards the high rate applied on the second strip.
Dr. G. Kachanoski first proposed this concept (delta yield) when he was working at the University of Guelph and others continue to explore the relationship between response to nitrogen and optimum rates. After years of evaluating more than 400 nitrogen response trials researchers have redefined the relationship between corn yield response and optimum nitrogen rates based on Ontario data. The inputs for this relationship are quite straight forward:
• corn yield from a zero nitrogen strip
• corn yield from a non-limiting nitrogen strip
• price of corn
• cost of nitrogen fertilizer.
Table 1 shows estimated fertilizer nitrogen rates needed to produce maximum economic corn yields for a range of corn yield responses. Yield response is the difference between yields associated with a non-limiting rate and a zero nitrogen (or starter nitrogen only) rate.
| Table 1. Estimated optimum fertilizer N rate for corn based on size of grain corn yield response to fertilizer N assuming a corn price of $4.10/bu and fertilizer N cost of $0.55/lb-N (Nitrogen:Corn Price Ratio of 7.5). | |
| Yield Response (bu/acre) |
Estimated Optimum Nitrogen Rate (lbs N/acre) |
| 0 5 10 20 40 60 80 100 |
0 0 31 70 100 119 135 150 |
For example, a producer applies 15 pounds of nitrogen in the starter and an additional 150 pounds to the field as broadcast urea; the yield is 170 bushels per acre on average. He also leaves several check strips in the field were the only nitrogen applied was the 15 pounds of starter nitrogen; these strips yield 130 bushels per acre. The yield response is 40 bushels per acre (170 – 130) and our estimation of the optimum rate for that field is 100 pounds of nitrogen per acre (in addition to the 15 pounds of starter nitrogen). The estimated optimum nitrogen rates presented in Table 1 are always the rates of nitrogen to be applied in addition to the starter rate.
A calculator can be downloaded at www.gocorn.net (look for the Yield Response Nitrogen Estimator icon) that is capable of calculating nitrogen requirements for corn grain yield responses, corn prices and nitrogen costs — based on the producers’ individual scenarios.
utilizing your findings
Including zero nitrogen, or starter nitrogen only, strips in corn fields can provide a fairly reliable estimate of the actual fertilizer requirement. There is some potential economic loss from the zero nitrogen strips, but when you factor in the nitrogen savings this loss is often considerably less than anticipated and outweighed by the benefits that may result in improved nitrogen management. Here are three possible scenarios to consider:
Grower A has legumes and manure. She realizes that the fertilizer nitrogen requirements for corn are low but would like to do some simple field testing to see how low that rate actually is. She leaves a few zero nitrogen strips, plugs the numbers into the Yield Response Nitrogen Estimator and the resulting rate estimations may build her confidence in lowering future nitrogen rates.
Grower B has corn yields that have increased dramatically over the last six years. He farms some very productive loam soils and does not want to be caught short on nitrogen, but also is interested in maximizing profitability. He compares his current rate (170 pounds of nitrogen) to starter only (20 pounds) in order to get a better handle on his nitrogen management strategy for the future.
Grower C is family farm with a real interest in site specific nitrogen management. They struggle to know how much variability actually exists across some of their fields and whether it is worth chasing with variable rate applications. They have a well calibrated yield monitor in the combine and set out to look at yield response numbers between zero and full rate strips as they move down the field. The decision to pursue site specific nitrogen rates may hinge on how much variability there is in the estimated optimum rates.
As these examples demonstrate, the information discovered utilizing this simple field-scale test and calculator can be extremely helpful in planning future nitrogen management decisions. For more information and access to the Yield Response Nitrogen Estimator visit www.gocorn.net. •


