Market side: Futures trading basics
LESSON 29: TECHNICAL ANALYSIS

SHORT TERM AND INTERMEDIATE TERM TRENDS
THIS LESSON WE will look at intermediate term trend (ITT) and short term trends (STT) and how to trade them.
Once we have established the primary or long term trend, we will use the information to plan a trading strategy. First and foremost is the concept that you should always trade with the trend. By identifying the primary trend we will now confirm this with the ITT. This is usually identified by a weekly continuation chart. The weekly corn chart shows the ITT and where we should look for support and resistance.
The chart shows a clearly defined downtrend line where we have month after month of lower highs and lower lows. This is the intermediate or medium term trend and the one we usually used to determine the direction of the trade.
Farmers need to view the downtrend as a tool to help you pick a point at which time it is beneficial to sell some or all of your crop. In this case, we see that the trend is down as it has been for several years. For this reason we do not try to guess when or if it will turn bullish but rather use the trend to our advantage by selling into the resistance area on the chart. If and when the trend breaks to the upside and reverses, we will adapt our new policy of trading with the trend in a bullish mode, but for the moment we need to trade with the down-trend and sell into strength. If one would have followed this strategy they would have considered selling either physical product or selling futures contracts at resistance points in July 2013, April 2014, June 2016, and again when we hit the $4 area in the possible near future.
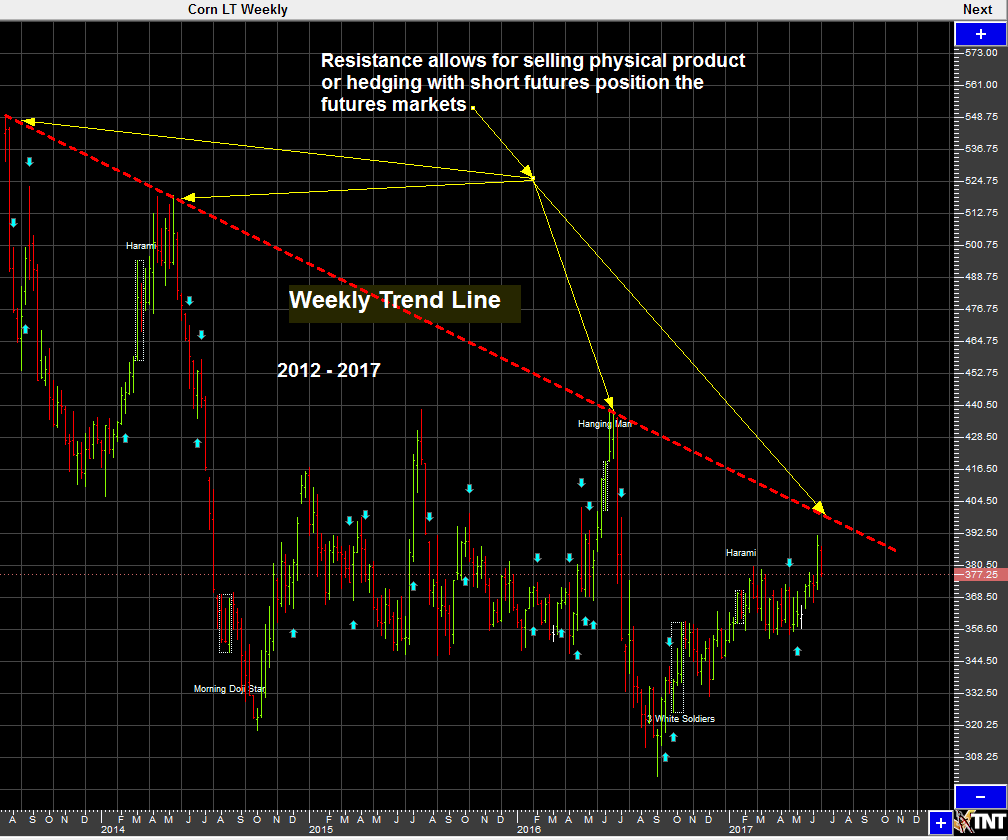
As for hedgers or speculators, we would consider the above mentioned price points as well as the $4 mark on the contract as a possible short selling opportunity since the trend is down and one would assume that the trend will remain down — except for the one time that they were wrong and the actual trend would reverse.
Next lesson we will discuss setting up a trade using the daily and intra-day charts. •
|
Lesson Definitions: Uptrend: A formal uptrend is when each successive peak and trough is higher than the ones found earlier in the trend. Downtrend: Describes the price movement of a financial asset when the overall direction is downward. A formal downtrend occurs when each successive peak and trough is lower than the ones found earlier in the trend. |
Marty Hibbs is a 25 year veteran futures trader, analyst, and portfolio manager. Hibbs was a regular guest analyst on BNN for four years. He is currently a grain merchandiser with Grain Farmers of Ontario.
DISCLAIMER: This information has been compiled from sources believed to be reliable, but no representation or warranty, express or implied, is made by the author, by Grain Farmers of Ontario, or by any other person as to its accuracy, completeness or correctness and Grain Farmers of Ontario accepts no liability whatsoever for any loss arising from any use of same.


