Market side: Futures trading basics
LESSON 19: TECHNICAL ANALYSIS, CHARTING

This monthly educational series will feature the basic workings of the futures and options markets and how they can be utilized to help farmers with risk management.

BAR CHARTS
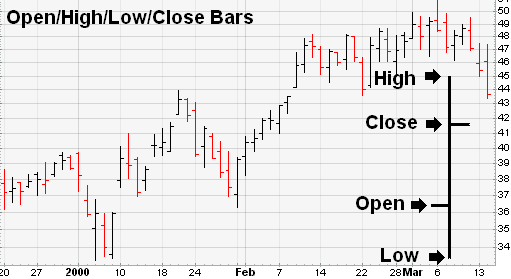
The first choice in charting in the American and Canadian financial world seems to be the bar chart. The chart is made up of vertical bars, each one representing a designated time period. The daily chart is simply a bar chart where a single bar represents one day of trading. These are the most popular type of charts used in technical analysis. One addition to bar charts is the hash mark (-) which is placed on the left side of the bar to represent the opening price for that time period and one on the right side of the bar representing the closing price for that period. The top of the bar shows the high for the period in question and the bottom of the bar represents the low for the time period. Along the right side of the bar chart is usually a price scale showing the price increments in the currency of your choice and along the bottom of the chart is a timeline which could be in minutes, hours, days, or even weeks, months, or years. The visual representation of price activity over a given period of time is used to spot trends and patterns.
Below is a typical daily bar chart with an inset showing the hash marks and what each bar represents.
LINE CHARTS
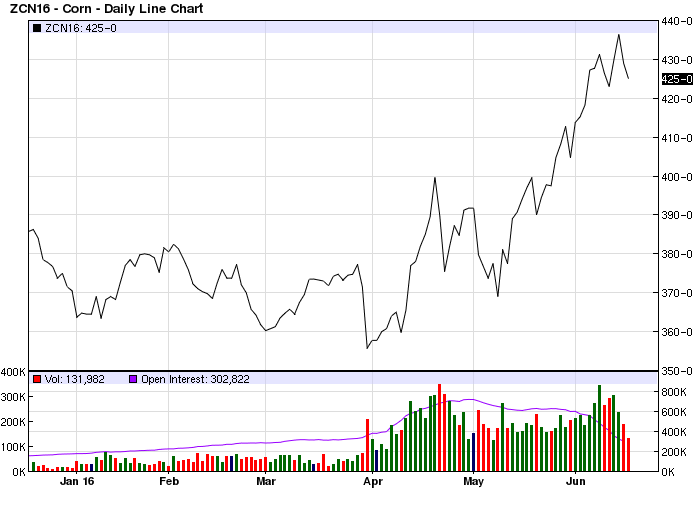
Unlike bar charts, line charts show prices in a continuous line over a given period of time. Line charts do not show open, high, or low prices. The only price indicated on a line chart is the closing price. This is accomplished by constructing a chart made only with dots on each given timeframe such as a day, hour, or even a minute; these dots are then connected to form a continuous line. The chart below shows a price history based only on the closing prices for each time frame.
CANDLESTICK CHARTS
The candlestick charts, so named because of their candle and wick like bodies, originated in eastern Asia and were developed almost 300 years ago by a man named Homma. A trader in the futures market, Homma discovered the basis for the candlestick chart analysis, which is used to measure market emotions surrounding a stock. Originally this method of charting was used to trade rice.
This charting technique has become very popular among traders. One reason is that the charts reflect only short-term outlooks, sometimes lasting less than eight to 10 trading sessions. Candlestick charting is a very complex and sometimes difficult system to understand. As we move along in our lessons we will attempt to explore candles and how they differ from today’s bar chart. We will also learn the most commonly used patterns and their unique names.
Next month we will discuss the basic patterns using the bar chart method. l •
Marty Hibbs is a 25 year veteran futures trader, analyst, and portfolio manager. Hibbs was a regular guest analyst on BNN for four years. He is currently a grain merchandiser with Grain Farmers of Ontario.
|
Lesson Definitions: Chartist: An individual who uses charts or graphs of a security or other financial instrument’s historical price patterns to forecast its future direction or trend. A chartist essentially looks for well-known patterns such as double tops, double bottoms, head-and-shoulders, or support and resistance levels in securities so as to trade them more profitably. Chartists may use their expertise in all markets where financial instruments are traded. These may include, equities, ETF’s, currencies, commodities, or corporate and treasury bonds. A chartist is also known as a technical analyst due to the fact that his/her decisions are driven not by fundamentals but by chart patterns and volume data. |
DISCLAIMER: This information has been compiled from sources believed to be reliable, but no representation or warranty, express or implied, is made by the author, by Grain Farmers of Ontario, or by any other person as to its accuracy, completeness or correctness and Grain Farmers of Ontario accepts no liability whatsoever for any loss arising from any use of same.


