Market side: Futures trading basics
LESSON 22: TECHNICAL ANALYSIS

This monthly educational series will feature the basic workings of the futures and options markets and how they can be utilized to help farmers with risk management.
OVER THE NEXT two lessons, we will discuss triangle formations in our charts and decipher what they are telling us about the market with regards to a possible direction signal.
Triangles fall in the category of continuation patterns. The formation usually denotes a measuring tool for the current trend and is usually not considered a reversal of the current trend.
The three formations that comprise triangles include ascending, descending, and symmetrical triangles. The first one we will explore is the symmetrical triangle.
The symmetrical triangle, which is sometimes referred to as a coil, usually forms during a trend as a continuation pattern. The pattern has an appearance of a triangle with equal sides. The highs of the pattern are gradually lower, while the lows are increasingly higher, until the bars consolidate toward a point. When these high and low points are connected, the lines converge as they are extended and the symmetrical triangle takes shape. You could also think of it as a contracting wedge, wide at the beginning and narrowing over time.
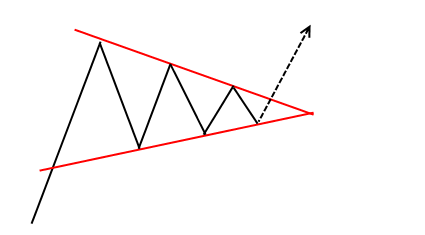
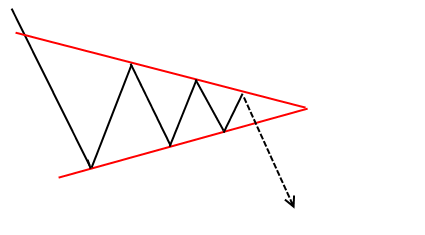
A quick glance of this formation looks as though the price action is confining itself to a narrow range which will ultimately be squeezed into a point where both the highs and the lows will converge and be forced to decide on a direction. This type of triangle chart pattern can appear in an uptrend or a downtrend. When the support trend line joining consecutive lows and the resistance trend line joining consecutive highs are drawn, they result in a convergence of two trend lines with a degree of symmetry. This particular formation indicates a period of indecision where there appears to be no real direction in the market. There is also a tendency for volumes to drop off during the formation of this pattern. Eventually, the price will break out of the triangle, usually this break out is accompanied by an increase in volume, and is usually a continuation in the direction of the existing trend.
HOW TO TRADE IT
In a symmetrical triangle, we watch for a breakout of the triangle in the direction of the existing trend as we approach the vertex. One way is to place a stop entry order to enter the market after a close outside of the wedge if the move is in the direction of the trend. A break in the opposite direction is not a valid signal and is more prone to failure.
Volume is key to the confirmation of the break out. Many traders prefer to see at least one day breakout with the volume before taking a position. This strategy is considered a safer bet as it can prevent a false break out. Of course, there is no perfect strategy as the breakout could see a significant move and the trader is caught chasing the market. •
Marty Hibbs is a 25 year veteran futures trader, analyst, and portfolio manager. Hibbs was a regular guest analyst on BNN for four years. He is currently a grain merchandiser with Grain Farmers of Ontario.
|
Lesson Definitions: Continuation patterns: These patterns include flags, pennants, triangles and rectangles. They are associated with a move in the direction of the main trend once the pattern is complete. |
DISCLAIMER: This information has been compiled from sources believed to be reliable, but no representation or warranty, express or implied, is made by the author, by Grain Farmers of Ontario, or by any other person as to its accuracy, completeness or correctness and Grain Farmers of Ontario accepts no liability whatsoever for any loss arising from any use of same.


