Cropside: Field trial ‘R&R’
AGRONOMIC INFORMATION FROM ONTARIO'S CROP SPECIALISTS
THE 2018 CROPPING season is over and you might be thinking about trials for 2019. OMAFRA field crop staff harp on the importance of randomization and replication (R&R) to get the most out of field trials. Are we just being a pain or is it actually important?
I’ve talked with growers who have made agronomic decisions on their farm based on results from single unreplicated strip trials. They observed a yield response to a new product, practice, or hybrid that more than covered the cost and therefore it made economic sense to make that change going forwards. Seems like a logical decision, no?
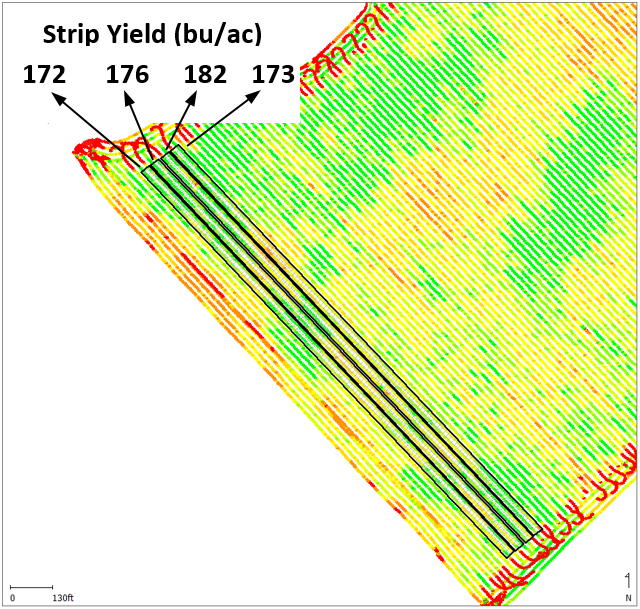
It’s excellent when growers conduct trials, but one challenge of making conclusions from non-replicated data is the inability to know whether the yield difference was due to the new treatment or just background variability of the field. There can be significant variability strip-to-strip even when practices are constant. Figure 1 shows four side-by-side strip yields from a corn yield monitor where all practices were constant. Yields averaged 172, 176, 182 and 173 bushels per acre (bu/ac). If you had tested a new product or practice in strip three and used strip four as your standard practice check, it could be easy to attribute the nine bu/ac yield difference to the new product or practice, when in this field background variability alone was enough to cause this difference.
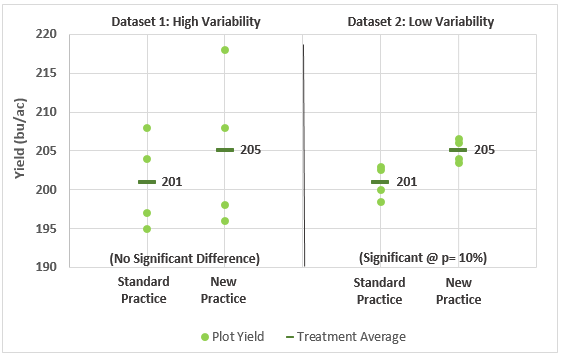
Replicating each treatment multiple times gives a picture of background variability in the field. We can then use statistics (cue eye roll) which compares background variability within treatments to the differences between treatments to determine the probabilities that differences between treatments are real. If treatment differences are small relative to background variability, the probability that yield difference are actually due to the treatments may be low. If treatment differences are large relative to background variability, we may be more confident there is a true treatment effect (Figure 2).
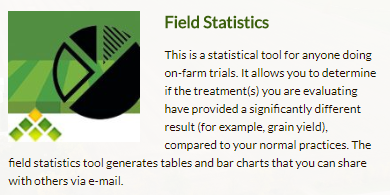
If you have replicated data, conducting stats is easier than ever thanks to the Field Statistics App developed by Agrimetrix with assistance from Grain Farmers of Ontario funding (Figure 3). It can be used online or as a phone app and is found on Grain Farmers of Ontario’s mobile app webpage (https://gfo.ca/about/mobile-apps/).
Randomizing replicated treatments is also important to control against any potential gradients that may exist in the field, or unforeseen circumstances where one treatment may influence others beside it. •