By the numbers: then and now
WHAT WE LEARN FROM THE CENSUS OF AGRICULTURE
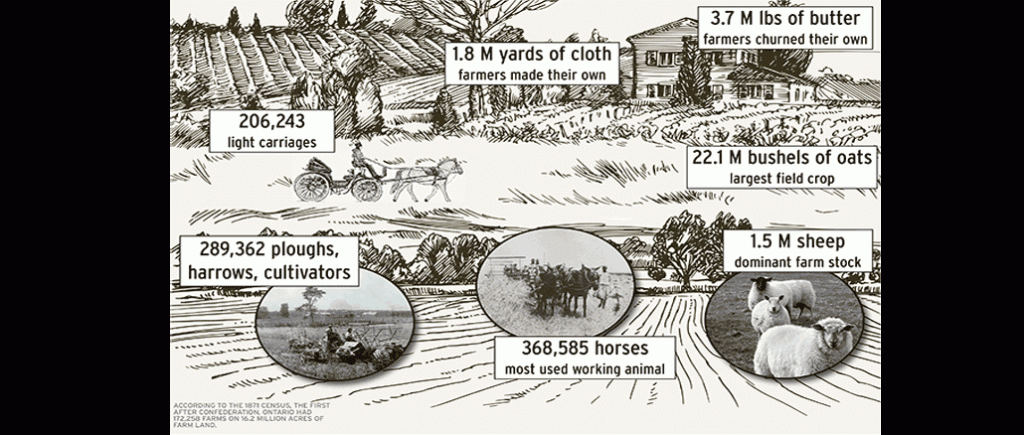
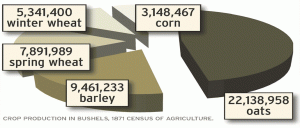
IN THE LATE 1800s, an Ontario farmer planted the fields with oats and wheat, used horses to pull their plows, reapers and mowers, and had more sheep than dairy cows and swine combined.
This picture of farm life can be painted thanks to the information found in the 1871 Census — the first after Confederation.
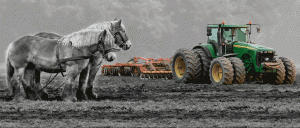
“Flipping through the old census books in our library provides a fascinating snapshot of how agriculture and society evolved,” says Erik Dorff, an analyst with the Agriculture Division of Statistics Canada. “We’ve tracked a move from the power of horses to the horsepower of complex machinery — from guiding the plow behind a horse to having GPS guide the tractor with auto steer.”
TRACKING INDUSTRY CHANGE
In the 1871 census, 368,585 working horses were reported in Ontario. In the 2016 Census of Agriculture (the data from which was released this May), 64,536 horses and ponies were reported in the province; but as Dorff notes, they no longer specify if those horses are used as part of the farm operation or are for recreational purposes only.
How horses are recorded is just one example of how Statistics Canada has evolved the Census of Agriculture to reflect changes within the industry.
“In the 1871 Census, we asked about linen production and homemade cheese,” says Dorff, “today we ask about organic production, renewable energy, and direct marketing.”
For the first time, the 2016 Census also asked farmers if they have a written succession plan for their operation (only 8.5% of farms in Ontario have one).
“At a series of workshops held across the country in 2012, Census of Agriculture staff consulted with governments, farm associations, producer groups, private sector analysts, academics, farmers, and members of the public. At that time, interest was expressed in a succession planning question to assess how farm assets would be transferred as aging operators chose to exit the sector,” explains Dorff, noting that in 2016, the average Ontario farmer was 55.3 years old.
The transfer of assets is expected to be significant, particularly given the cost of farm land in the province. According to the 2016 Census, the average value of land and buildings alone is now $9,580 per acre — an increase of 41.4% since the 2011 Census.
Despite the rising costs, the area of land in crops has increased to nine million acres. Soybeans covered nearly 2.8 million of those acres in 2016, making it the largest field crop in the province, and making Ontario the largest soybean growing region in the country. The growth of soybeans is another interesting story that can be told through Census data.
While soybeans were introduced in Canada in the mid 1800s, they weren’t even counted in the 1871 census. The crop didn’t become commercially viable until the 1920s when a crushing plant was built and new varieties better suited to our climate started to become available. Statistics Canada didn’t begin to collect soybean data until 1941. At that time 10,873 acres were reported. Soybean acres grew exponentially in southern Ontario, reaching 155,595 acres by 1951. Statistics Canada captured another spike in acres planted with the 1976 release of soybean varieties that had an earlier maturity and better tolerance for cooler climates which allowed for more soybeans to be planted in eastern Ontario. Between the 1976 and 1981 censuses the soybean area across the province nearly doubled in size.
ADAPTING TO CHANGE
It’s important that the Census of Agriculture changes over time, however, changing it isn’t a simple process. For the 2016 survey, Dorff says they first tested new or changed questions with producers across the country before the content and design was finalized in 2014. Questions then had to be approved by Cabinet and prescribed by Order in Council as required by the Statistics Act.
It’s also not just what is asked that has changed, but how it is asked. According to Dorff, the 1871 Census would have been completed with an enumerator — a person who was employed to go farm to farm to take the census. A paper copy of the Census of Agriculture is now mailed to all farms, with the option to complete the survey online. In 2016, 55 per cent of agricultural operators filled out their questionnaire electronically.
With all of the other paperwork that farmers have to deal with, completing the Census of Agriculture — at 14 pages long — can seem like a daunting task at first. But Dorff clarifies only a fraction of the Census applies to most operations. If crops and livestock are all that are on your farm, you can ignore the questions relating to other aspects of agriculture, such as greenhouses, Christmas trees, and bees. It’s also important to keep in mind that the information collected in the Census isn’t just for curiosity’s sake.
“The data produced by the Census of Agriculture are used by federal and provincial governments for the purposes of providing critical information to manage their expenditures in support of the agriculture sector,” explains Dorff. “It is useful for public and business decisions, such as helping direct billions of dollars annually in financial assistance to farmers. This includes programs which support the Canadian agriculture and agri-food sector such as those delivered in the agricultural policy framework Growing Forward 2 — AgriInvest, AgriStability, AgriInsurance, AgriInnovation, and AgriCompetitiveness.”
If you’re interested in learning more about the results from the 2016 Census of Agriculture, go to www.statcan.gc.ca/eng/ca2016. To learn more about the history of agriculture in Ontario and across Canada, look for ‘Telling Canada’s Story in Numbers’, a series of activities and events Statistics Canada is using to mark the 150th anniversary of Confederation. •


