Compaction action
CHASING OUR UNDERSTANDING OF SOIL COMPACTION
FOLLOWING THE SUCCESS of the Innovative Farmers Association of Ontario (IFAO) Compaction Action Day in Arthur a year ago, a group of those involved decided that this event should just be the start of exploring soil compaction more thoroughly here in Ontario.

Through funding secured from Grain Farmers of Ontario and the Ontario Soil and Crop Improvement Association, we set off on a number of fronts to continue to educate farmers about compaction. This included posting videos and graphical results of the September 2017 event on the IFAO website (www.ifao.com). It also involved a significant number of presentations across the province this past winter highlighting the learnings from Compaction Action including the Southwest Agricultural Conference, FarmSmart, Eastern Ontario Crops Conference, the Ontario Fruit and Vegetable Growers’ Association Convention, and many other smaller events.
What we learned from those presentations and discussions with farmers and ag business representatives was:
1. There is lots of interest in this subject across Ontario
2. There are a lot of unanswered questions
3. Compaction demonstration and research is difficult and confusing
4. Each field offers new and unique conditions that impact the severity of soil compaction
5. Trying to replicate conditions for soil compaction during long hot drought periods mid summer is difficult
EQUIPMENT
In trying to address the questions above, another initiative of the group was to construct the sensors and related equipment needed to offer infield demonstration and research on soil compaction. That effort has resulted in the fabrication and assembly of the equipment which was piloted at events in Quebec, FarmSmart Expo in Elora, and the Canola Tour held this year at Cache Bay in northeastern Ontario. Demonstrations during the latter half of the summer included several small events and a larger event collaboration with Elgin Soil and Crop Improvement Association at Shedden, Ont. While the education group has limited resources in time and equipment, we are open to other events. Go to http://bit.ly/SoilCompactionDemos for information on what is involved in hosting a compaction demonstration event.
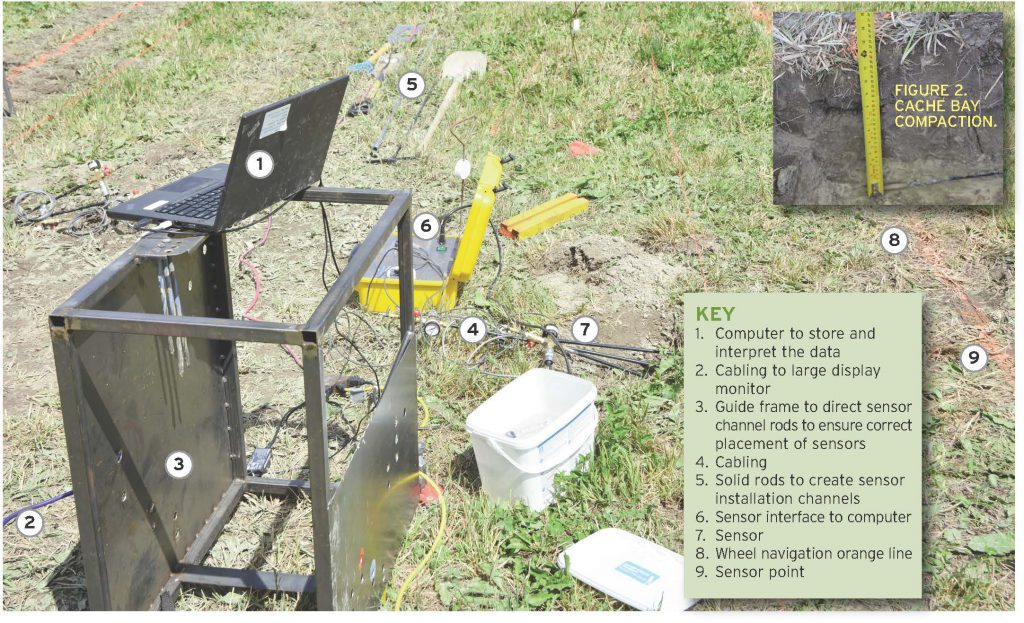
The equipment used to detect soil compaction (Figure 1) consists of a frame that is used to guide a sharp tipped solid rod which is carefully hammered into the soil at described angles to create a channel to allow sensors to be inserted at six, 12, and 20 inch depths in the soil. The sensors are a hollow steel tube with a short rubber hose on one end and pressure gauges (electronic and analog) on the other. These sensors are inserted into the holes made by the rods so that the sensors are placed underneath each other at the defined depths. Once the sensors are driven over a few times, the soil tightens around the sensor and we can read the pressure at each depth. The electronic pressure gauges are connected to a computer and the pressure is recorded every 0.1 seconds and displayed on a graph in real time for an audience to observe the impact of the different configurations of equipment that are run over the soil.
The pressures recorded are compared to a standard pressure value that through research in Europe has proven to be a proxy for threshold levels of stress that would result in physical soil compaction which the soil could not “bounce” back from. Thus, the pressure recorded is a proxy for soil compaction. While the threshold stress levels likely vary for different soil types and soil moisture conditions, they are the best approximations we have currently. The goal is to compare stress levels between configurations of equipment to understand which are the least likely to cause soil compaction and thus offer pretty clear trends in what conditions and configurations are better at avoiding or reducing the potential for soil compaction.
LESSONS
During our first three field events with the new equipment we learned a lot. Soils that have been through a prolonged drought period are immune to soil compaction, meaning the graphs that are produced lack the “shock and awe” observed at the event in September 2017. However, the lack of compaction in dry conditions reaffirms how important soil moisture is to the potential for soil compaction occurring when heavy equipment is operated. While rainfall or irrigation adds water to the soil, it takes a great deal of rainfall to drive moisture deep into the soil and thus deep compaction is reduced when soil moisture is limited. Closer to the surface, compaction can occur when the top six inches or so receives rainfall.
In Cache Bay, we added 4,000 litres of water to the 10 x 20 foot area for our measurements and still only detected pressure at six inches. The sensor at 12 inches (Figure 2) was embedded in dry clay and measured a maximum of four psi for the heaviest tire we tested.
One of our biggest learnings is that each soil, date, and equipment combination leads to different results every time in the stress exerted on soil to depth. This makes collecting and recording every detail very important as we continue to develop the Ontario soil compaction database. We need to carefully consider what we are learning in each situation so that collectively we can convey the right understanding of soil compaction and provide farmers and industry with the best data and understanding of soil compaction relative to each farmer’s unique situation so that the best decisions possible can be made to understand, avoid, and deal with soil compaction. •