Take advantage of the growing season
UNDERSTANDING HOW TO MAKE YOUR CHU WORK FOR YOU
AS WE REFLECT on last year and make decisions for this year, we need to learn from the 2019 season, and apply key findings to our future decisions.
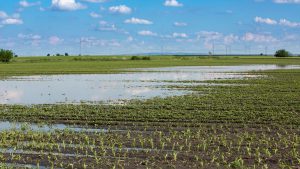
Many of us will remember 2019 as a year with too much rain: wet spring, wet fall, wet fields, wet crops, all around wet. It seemed like the growing season was short, crops took longer to mature, and were wet at harvest. So, did we get less heat than a normal year?
One way to calculate the growing season is to measure the crop heat units (CHU). Based on the calculations from Weather Innovation (WIN) many areas from Windsor to Trenton and along the southern edge of the province saw a rise in accumulated CHU in 2019 compared to the 30 year average. In Hamilton, Peterborough, and Elora the data indicates there were fewer CHU than the 30-year average. So, like most years, it was variable across the province with some areas accumulating more heat while others were at the 30 year normal or below. We can call it an average year for heat accumulation in general terms for Ontario.
The feeling that 2019 was a short season was due to the fact that planting was delayed and not due to a loss of total seasonal CHU. Therefore, we should not assume our seasons are getting shorter or longer.
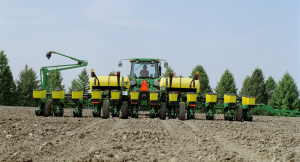
The best recommendation is to target your corn hybrid and soybean variety selection for an average season maturity for your region. When planting early, take advantage of the full season and plant full season products. These products will maximize your yields. As the spring planting windows close in, adjusting to earlier maturity products will ensure you mature your crop for timely harvest and appropriate grain harvest moisture.
The CHU information provided in this table from WIN are from May 1 to October 31. Please note the growing season is less than the accumulated CHU from this chart due to frost or cooler temperatures stopping plant growth well before October 31 in most areas. Refer to the corn CHU map for the maximum CHU for your area. For soybean relative maturity, refer to the chart for recommendations in your area.
| Location | CHU (May 1 – October 31) 2019 | CHU (May 1 – October 31) 30-year average | 2019 vs 30-year average |
| Chatham | 3860.7 | 3726.0 | 134.7 |
| Elora | 3085.9 | 3157.8 | -71.9 |
| Hamilton | 3152.3 | 3417.4 | -265.1 |
| London | 3583.3 | 3408.0 | 175.3 |
| Mount Forest | 3078.4 | 3076.5 | 1.9 |
| Ottawa | 3273.4 | 3258.6 | 14.8 |
| Peterborough | 3073.4 | 3115.5 | -42.1 |
| Trenton | 3336.1 | 3189.5 | 146.6 |
| Windsor | 4004.2 | 3737.3 | 266.9 |
| Woodstock | 3424.8 | 3351.8 | 73.0 |
Marty Vermey is Grain Farmers of Ontario senior agronomist.