Smarter farming
PROFITABILITY MAPPING PROVIDES VALUABLE INSIGHT
PROFITABILITY MAPPING MAY be the way to go for grain growers who want to realize higher profits while reducing costs, according to a recently completed demonstration project.

“I would definitely recommend this technology, especially with the cost of everything — it’s so expensive,” says Tyler McBlain. “We want to spend our money wisely, find out if we are losing it and, if so, how we can fix it.”
McBlain, his parents, and his wife farm 2,000 acres and do custom work on another 2,000 acres in Brant County north of Hamilton. They grow corn, soybeans, wheat and oats.
HOW IT WORKS
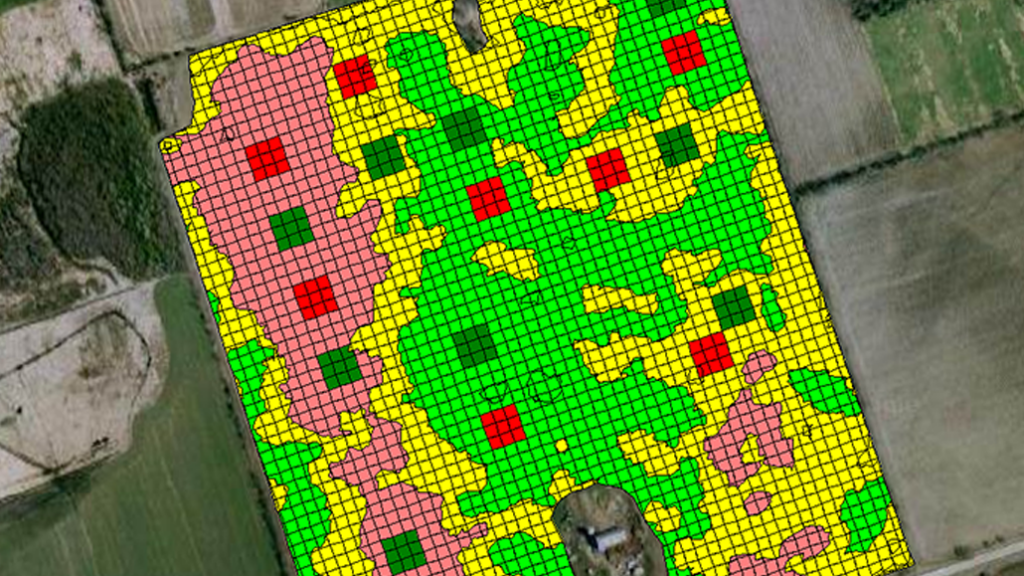
Profitability maps are generated from yield maps and cost of production data — including seed, fertilizer and other inputs. They show the geospatial distribution of profitability in individual fields, for example, the difference between a hill and a valley or a headland and the interior.
“It looks a lot like a yield map but shows what parts of the field are making money and which aren’t,” says Aaron Breimer, vice president of Data Insights with Deveron, an agricultural technology company that uses data and analysis to increase yields, reduce costs and improve outcomes. Breimer presented the results of a two-year demonstration project administered by the Grand River Conservation Authority (GRCA) during a webinar late last summer.
Sue Brocklebank, GRCA conservation specialist, headed up the project, which began in the fall of 2020 and included 10 farmers recruited in early 2021 to develop profitability maps on about 100 acres of crops each. Most of the crops were corn, soybeans, and wheat with some oats. The project was led by a steering committee comprising farmers, industry representatives, and the conservation authority, and was funded by the Ontario Ministry of Agriculture, Food and Rural Affairs. It was also supported by the Brant and Waterloo Ontario Soil and Crop Improvement Associations.
“We’re always looking for ways in which farmers and the environment can benefit,” Brockelbank says. “This was something we saw that could maximize nutrient use efficiency — reducing runoff — and help farmers be more profitable.”
Data security for the project was tight, with only Brocklebank, Breimer, and the landowner having access to the records.
For the first year, because they were deep into the busy planting season, they used provincial averages for input costs to generate the profitability maps.
“It was a good starting point but being able to use actual costs from the 2021 harvest was even more worthwhile because it was accurate to each operation,” Brocklebank says.
MUST HAVE GOOD, CLEAN DATA
Good data is essential to creating useful profitability maps, so having accurate records in terms of yield maps and costs of production is critical. Breimer says that some of the project participants used variable rate applicators, and this data was also included in the profitability maps.
“As with anything, if you put garbage in, you get garbage out,” says McBlain. “You have to take the time to get it right and prepare the data properly.”
Getting it right, however, can be a game-changer. Breimer cited an example from a conference he attended in the U.S. in which the presenters showed data from 2017 that indicated 52 per cent of all the land in their database was not profitable, which meant that 48 per cent of it was making up for the difference.
Breimer cautions that a big challenge to developing the maps is ensuring consistency in how records are named and recorded.
“You need to name the same fields the same way every time,” he says, adding that growers also use different names for the same input products. For example, 28 per cent urea ammonium nitrate (UAN) can be 28 UAN, 28-0-0, 28% or just 28. He suggests hiring someone to set up the naming convention and perhaps getting someone to clean up and organize their data if they’re not comfortable with that job or don’t have the time. For the project, Brocklebank pitched in to clean up some of the data.
“GIS (Geographic Information System) software is necessary to create the maps, so right now, farmers need to engage an agricultural services provider,” says Brocklebank, adding that, in the future, the technology may evolve to be more widely available commercially.
Surveys were conducted with the participants before and after the project, and overall, the consensus was that profitability maps are valuable. Two-thirds of the participants were interested in trying the technology again in different fields.
Coming out of the project, some farmers did more intensive soil sampling to discover what exactly was going on, and some made changes to their variable rate prescriptions or changed the zones that they had created for the profitability maps. Others changed up their cover crop strategies. One said he was going to start using cover crops as a result of the project.
YIELD ISN’T EVERYTHING
Brocklebank says that nowadays, the attitude is more about farming smarter, not just getting higher yields.
“You can get more profitable by getting the most out of your inputs versus putting a lot of nutrients on the field to obtain better yields,” she says, noting that with the high price of land, farmers are looking at getting more profit out of what they already have, rather than expanding.
McBlain agrees and says he will continue using profitability maps. He says he enjoys analyzing data and information, especially when it helps his bottom line. He actually had seven years’ worth of historical data to use for the project.
“It was a good exercise — now I know what’s not profitable, and I’m working on why it isn’t and finding out if it’s something we can fix,” he says. At the beginning of June, he was trying out a more precise way of managing his soil with Soil Optix, an agricultural technology company that maps, samples and analyses soil.
Going forward, Brocklebank hopes to be able to build on this pilot project and find ways to continue to support producers who want to try the technology. •