Test plot design
MOST OF US make hundreds of decisions per day — and we want those decisions to be good. Poor decisions in crop production result in failed economic opportunities, lower production, and risks to the environment. The best decisions are made after the acquisition and review of quality data. Unfortunately, many decisions are made from data cloaked as quality data.
Farmers can produce their own quality data for making better crop management decisions through on-farm research.
The first step is to determine the research goal or question. The best research is organized to address a very specific question. All research has certain limitations. All research has very specific assumptions attached to it. Any response differences (for example, grain yield) are at least partially caused by factors beyond our control, such as differences in soil variability. All of these must be considered when making inferences when reviewing the data. If the research is properly designed, a measure of variability — or experimental error— can be assigned to the data.
| On-farm testing Best management practices: • Select a field site that is as uniform as possible • Ideally, plot length should exceed 600 feet • State the research question – make it simple! • Choose a small number of treatments (smaller means better) • Plan for at least four replications (could be a comparison in four fields) with a small number of treatments • Validate that treatments are installed correctly • Take notes throughout the season (plot variability, etc.) • Record weather effects and other field characteristics • Aerial imagery can be extremely useful • All results are valuable, if the experiment is properly designed, even if the response is zero! |
Well designed experiments:
1. Are simple; address a specific question
2. Enable a direct comparison of treatments (for example, side-by-side strips vs. separate fields)
3. Avoid systematic error
4. Minimize bias and errors in the comparison
5. Have broad validity (not specific to a rare soil type, etc.)
6. Make statistical inferences (how confident are we that the difference is due to the comparison and not other factors like soil variability)
7. Are consistent and repeatable
Some poorly designed experiments:
1. Attempt to address too many questions at once (experiments become too large; inherent field variability becomes large)
2. Have too many treatments or comparisons (distance between comparison strips increase)
3. Do not replicate and randomize treatments or comparisons (bias is possible and no measure of variability)
4. Do not control or minimize variability (inherent variability across the field may be greater than any real difference in the comparisons, thus no real treatment difference can be detected even if one exists)
CASE STUDY
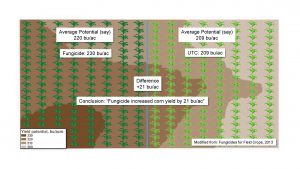
Let’s look at a case study. The following example was modified from Fungicides for Field Crops (2013). A grower has formulated the research question: does a fungicide applied at VT increase grain corn yield on my farm?
A 50 acre field is chosen and split in two; a fungicide is applied on the east 25 acres (noted by the dark green plants (left) in Figure 1) and no fungicide is applied on the right 25 acres (light green plants (right) in Figure 1). Each 25 acre block is harvested and the yield calculated. The conclusion was that the fungicide increased yield by 21 bushels/acre (bu/ac).
However, is this accurate? No.
If the variability in yield of this field was measured with a uniform practice across the field, it would be discovered that the 25 acres on the east side had a yield potential of 220 bu/ac and the west side 209 bu/ac. Therefore, since the side chosen for the fungicide had a higher inherent yield potential, the conclusion that the fungicide increased yield by 21 bu/ac is false and overrated, and if believed, it could factor into fungicide decisions that may not be warranted.
Conversely, if the fungicide was applied to the side of the field with inherently low yield potential, then this too would equate to an erroneous conclusion, as the impact of fungicide would be underestimated.
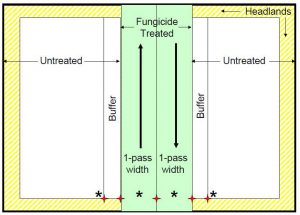
AN IMPROVED EXPERIMENTAL DESIGN OF AN ON-FARM TRIAL TO DETERMINE THE GRAIN YIELD RESPONSE IN CORN WITH A FOLIAR FUNGICIDE AT SILKING. ONE SPRAYER PASS (GREEN) AREA RESULTS IN TWO REPLICATIONS OF A SIDE X SIDE COMPARISON OF UNTREATED VS. SPRAYED (WHITE VS. GREEN).
MODIFIED FROM OSBORNE (2010).
In this case, a much better experiment could have been designed with very minimal additional effort.
On-farm experiments need to be designed to minimize any inherent background variability when comparing the treatments of interest (such as the effect of a fungicide); however, there is no such thing as zero variability or zero experimental error. On-farm experiments need to be designed to measure this error.
A much better experimental design for addressing the research question is illustrated in Figure 2. In this field, only one sprayer pass was made down the field, with no fungicide applied on either side of the pass. One pass with the combine can be made in the untreated on the left and the yield noted, followed by another combine pass in the sprayed and the yield noted. This is repeated on the other side of the sprayed pass. In total, there are four data points of yield or two replications. This is a very simple test design and easy to install.
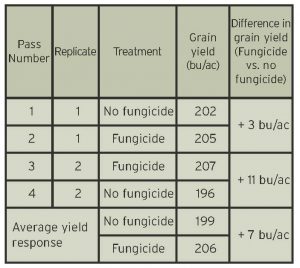
Actual data from such an experiment in 2012 is listed in Table 1. In this simple trial, the average grain corn yield response to fungicide was +7 bu/ac. In this trial, inherent field variability was minimized by keeping the comparisons close together. Strips that are close together will tend to minimize inherent spatial variability, which means more of any real treatment effect may be observed. Note that if we only chose to compare one side of the spray pass, the conclusion would be very different, depending on which side we decided to make the comparison (+3 or +11 bu/ac). The variability in response may be due to a number of factors, but the replicated data can enable a measure to estimate the variability of the fungicide response. Statistically, even with this apparent consistent fungicide response across these two replications, we cannot be 90% confident that the +7 bu/ac response is different than zero; statistical power tends to be weak with only two treatments across two replications. If this experiment could be repeated a few times across the field or in multiple fields, then the power to detect real treatment differences and our confidence that any treatment difference is real becomes greater.
Dr. Dave Hooker, associate professor in the Department of Plant Agriculture at the University of Guelph Ridgetown Campus, was a presenter at the 2018 Technician Training Workshop. This article is part of series which highlights lessons from the workshop which may benefit farmer-members involved with on-farm research or those interested in doing some of their own field experiments. Go to www.ontariograinfarmer.ca to review all articles in the series.
The 2018 Technician Training Workshop was sponsored by C&M Seeds, Cribit Seeds, Dow AgroSciences, Grain Farmers of Ontario, Horizon Seeds, Maizex Seeds, Ontario Ministry of Agriculture, Food and Rural Affairs, SeCan, and the University of Guelph. •


